Printable template
Tally Chart Template
Category plus tally plus total.
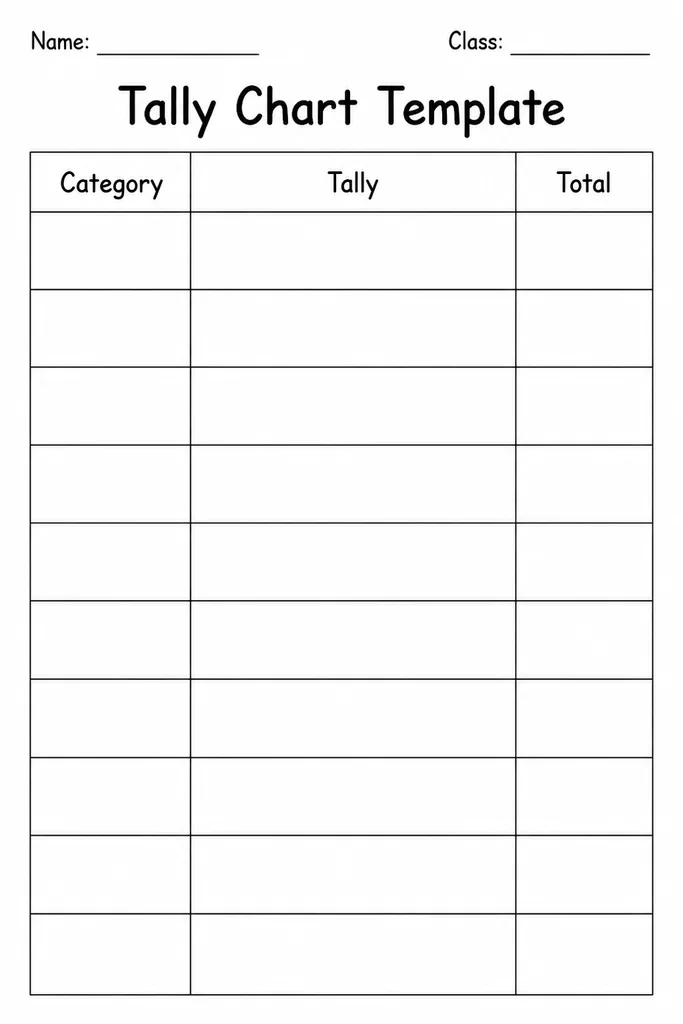
The tally chart template offers a three-column table—category, tally marks, and total—so students from kindergarten through grade 5 can record live observations quickly and neatly. Tally marks are the fastest way to capture counts in real time: one stroke per event, with every fifth mark crossing the previous four into a bundle of five that's easy to count. This printed structure takes away the cognitive load of drawing a table from scratch, letting even the youngest students focus on the act of counting and grouping. Teachers reach for it during whole-class sorting activities, science observations, or phonics sound-hunt exercises; parents use it at home for fun counting games.
Learning objectives
- Record raw data efficiently using tally marks
- Group tallies in sets of five for quick counting
- Total each category and compare frequencies
- Organise observations into labelled categories
- Transition raw tallies into a bar or pictograph
- Build early data-handling and number fluency
How to use this template
- Download and print the tally chart template on any standard paper size.
- Write a category name in each row of the first column (e.g. red, blue, green).
- Mark one tally stroke for each observation, crossing every fifth to form a bundle.
- After data collection is complete, count each row's bundles and write the total in the third column.
- Laminate for reuse in timed counting activities or whole-class polling throughout the year.
Classroom & home ideas
- Sort a bag of mixed colour counters and tally each colour—great for kindergarten sorting centres.
- During a nature walk, record each type of bird, leaf, or cloud shape spotted.
- Conduct a classroom survey ('What is your favourite season?') while practising tally convention.
- Tally the number of times a specific phoneme or sight word appears in a short passage.
- Run a data-collection relay: each table group tallies something different, then the class compares totals.
Skills practised
Frequently asked questions
How many category rows does the template include?
The sheet has 8 labelled rows, which covers most classroom surveys. If you need more categories, print two sheets and staple them together.
Is this suitable for kindergarten students?
Yes. Kindergarteners can use it with teacher guidance. For very young learners, pre-fill the category names so they only need to mark the tally strokes.
Why do tally marks come in groups of five?
Grouping in fives mirrors the skip-counting by fives that students learn early on, making it much faster to total a long column of tallies than counting stroke by stroke.
Can students move from this tally chart directly to a bar graph?
Absolutely. The category column and totals map directly onto a bar graph's x-axis labels and bar heights, making it a natural two-step data project.
Likes & comments
See what other teachers think and share a helpful note.
Create more worksheets in our Worksheet Studio
Generate fresh worksheets for any grade, topic, and language — free.
Open the Worksheet StudioRelated worksheets

Triangular / Tessellation Grid
Frequency Table Template
Fraction Wall (Blank)
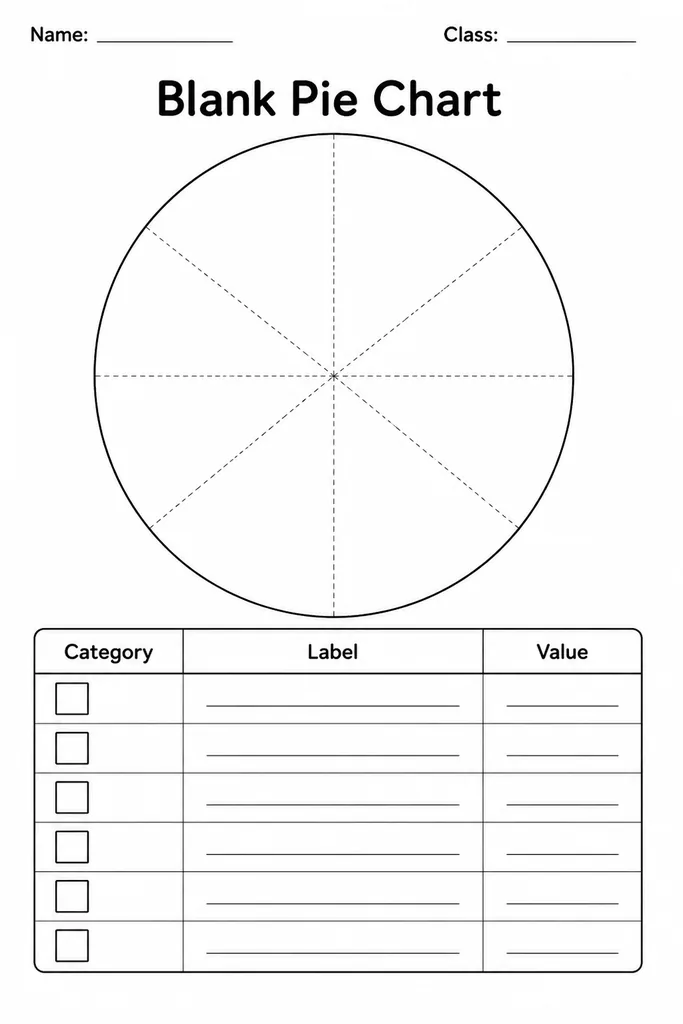
Blank Pie Chart
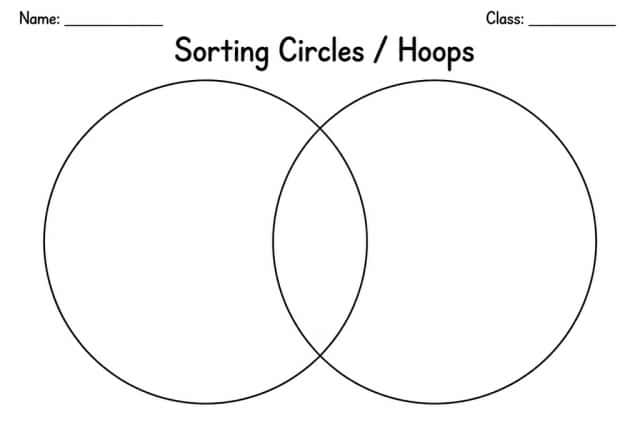
Sorting Circles / Hoops
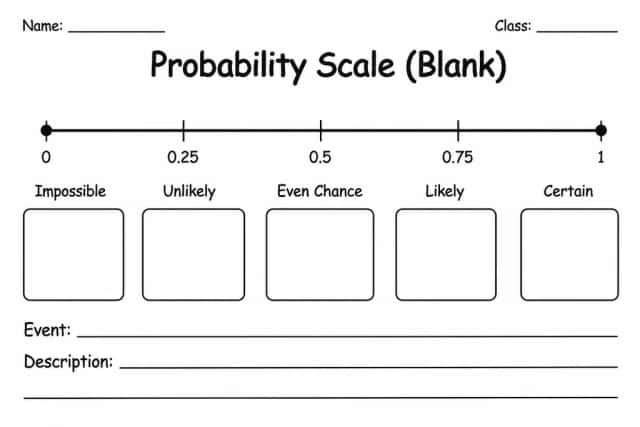
Probability Scale (Blank)
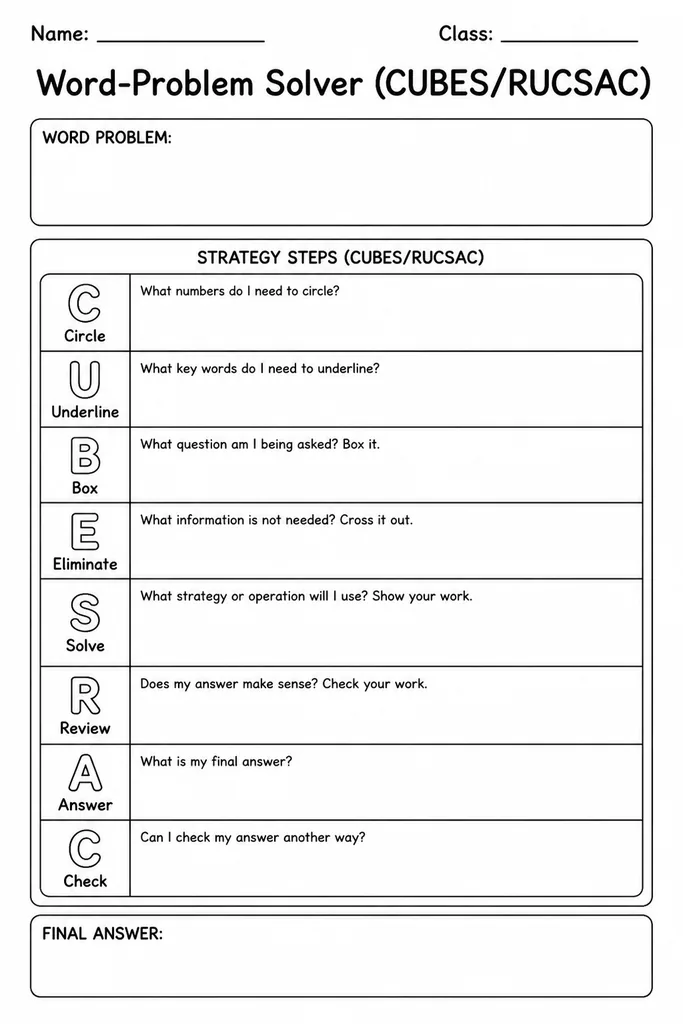
Word-Problem Solver (CUBES/RUCSAC)