Printable template
Frequency Table Template
Blank rows for collecting data.
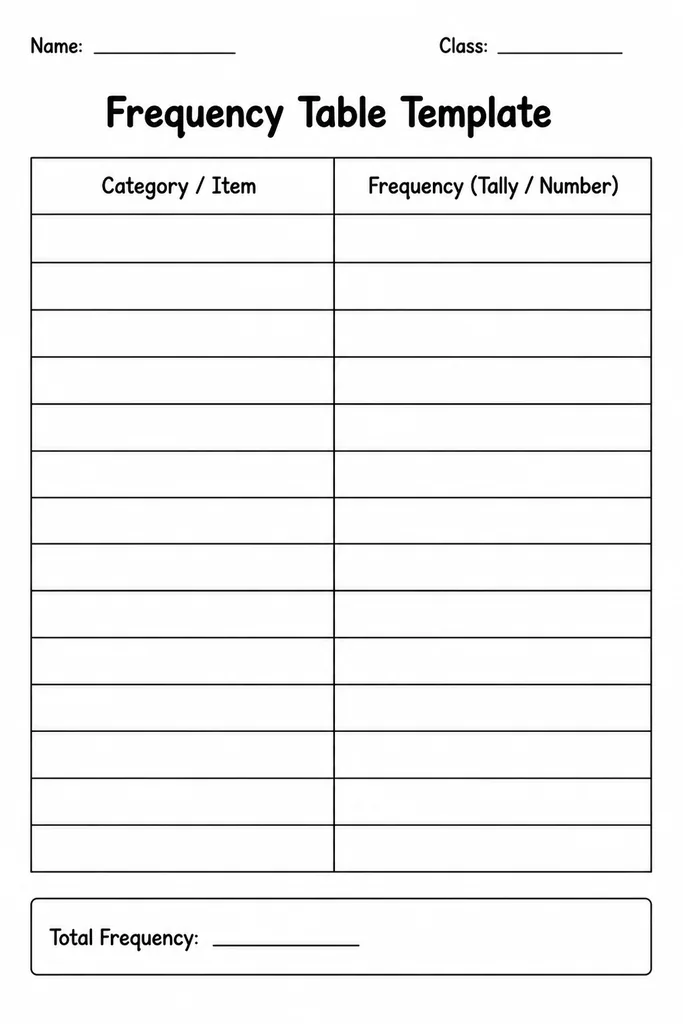
The frequency table template provides a clean multi-column table with blank rows for recording values or intervals and their corresponding counts, making it the go-to data-organisation tool for grades 2–8. Unlike a raw tally chart, a frequency table can group data into class intervals (e.g. 0–9, 10–19) or list individual values alongside frequencies, relative frequencies, or percentages depending on grade level. Teachers in both maths and science lessons use it as the first step before constructing histograms or bar charts; older students in grades 6–8 use it to organise large data sets and calculate measures of central tendency from grouped data.
Learning objectives
- Organise raw data values into an ordered table
- Define and record class intervals for grouped data
- Calculate and record frequencies and relative frequencies
- Use the table as a precursor to constructing graphs
- Identify the mode and range from a completed table
- Handle both discrete and continuous data systematically
How to use this template
- Download and print the frequency table template on letter or A4 paper.
- Choose your data categories or intervals and write them in the first column.
- Record the frequency count for each category in the second column as you collect data.
- Add optional columns for relative frequency or percentage if the activity requires it.
- Use the completed table as a planning sheet before transferring data to a bar chart or histogram.
Classroom & home ideas
- Survey students' shoe sizes and record in a frequency table before plotting a bar chart.
- After a spelling test, group scores into intervals of ten to build a grade-distribution table.
- In science, record the number of seeds that germinated each day to spot growth patterns.
- Collect word-length data from a short passage—how many 1-letter words, 2-letter words, etc.
- Use as a homework task: students survey family members' journey times to school or work.
Skills practised
Frequently asked questions
What's the difference between a tally chart and a frequency table?
A tally chart captures raw live counts with tally strokes; a frequency table is a neater summary that records the final numeric count, often with extra columns for relative frequency or percentage.
How do I choose the right class intervals for grouped data?
A good rule of thumb for this age range is 5–10 intervals. Divide the data range by your desired number of groups to set the interval width, then round to a convenient number.
Can younger students in grade 2 use this template?
Yes, for simple discrete data. Pre-fill the category names and ask students only to write the count number, keeping the cognitive demand appropriate for younger learners.
Can this template support a cumulative frequency column?
The blank extra column on the right is designed for exactly that. Students in grades 7–8 can add cumulative frequency to prepare for ogive curves or quartile work.
Likes & comments
See what other teachers think and share a helpful note.
Create more worksheets in our Worksheet Studio
Generate fresh worksheets for any grade, topic, and language — free.
Open the Worksheet StudioRelated worksheets

Triangular / Tessellation Grid
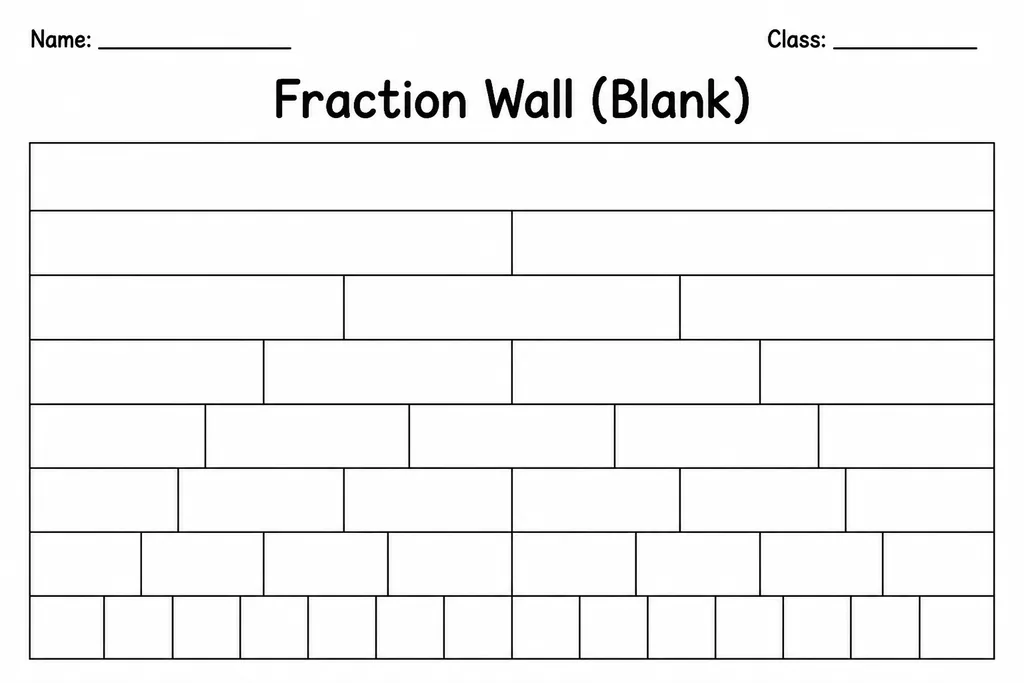
Fraction Wall (Blank)
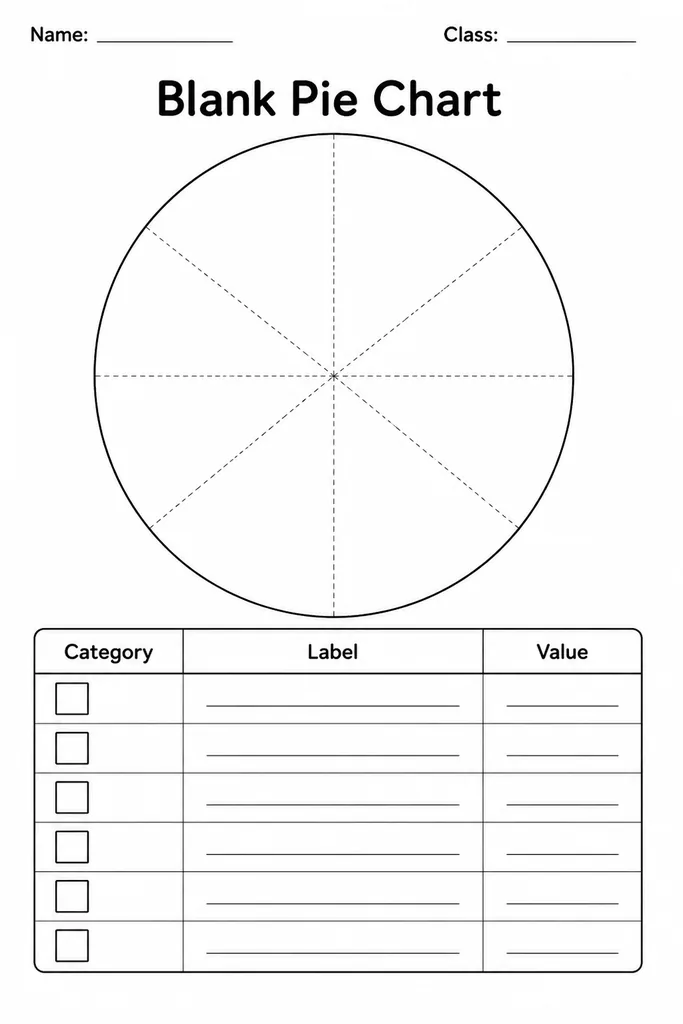
Blank Pie Chart
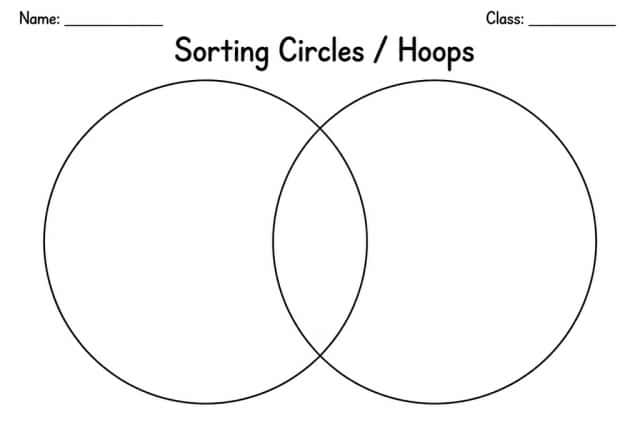
Sorting Circles / Hoops
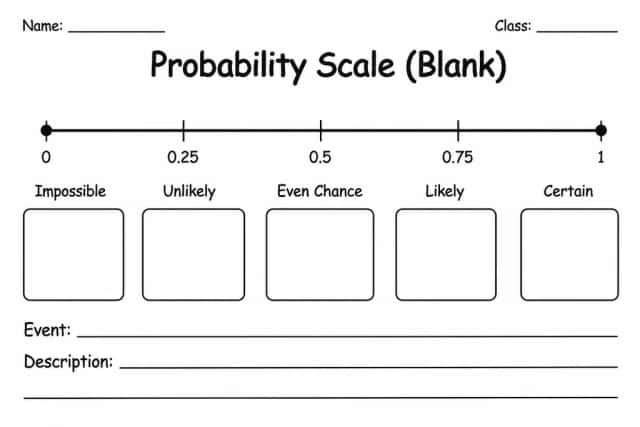
Probability Scale (Blank)
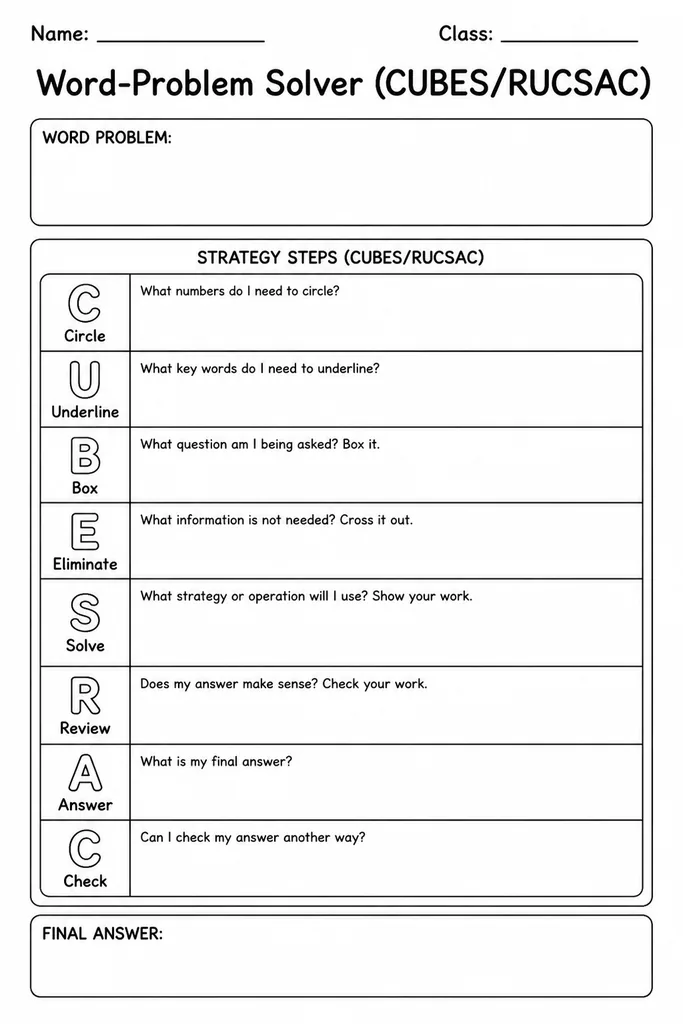
Word-Problem Solver (CUBES/RUCSAC)
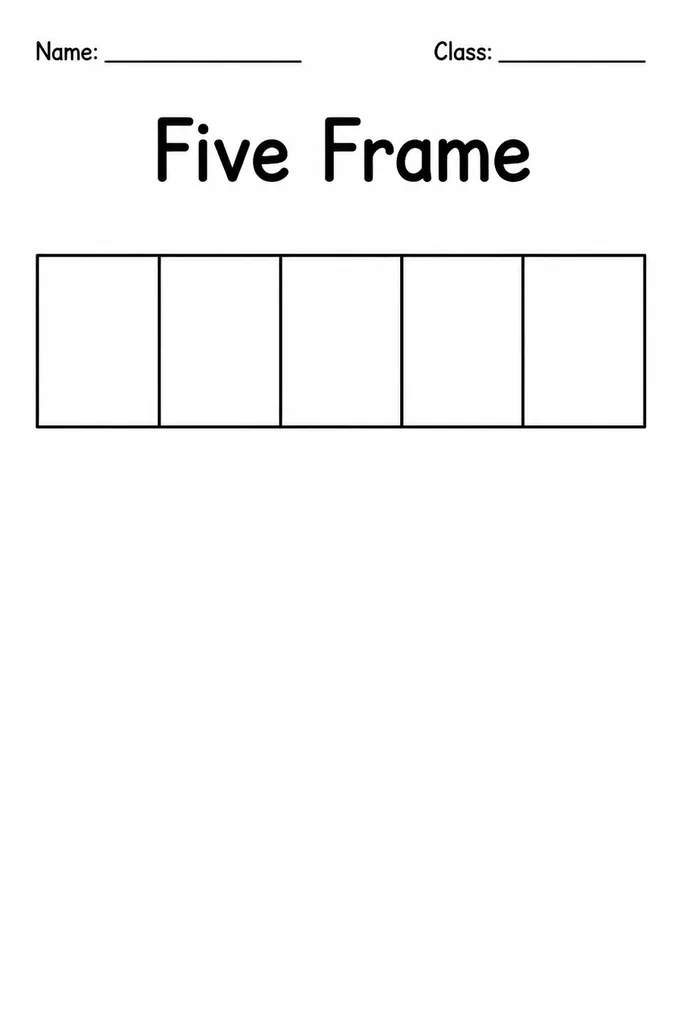
Five Frame