Printable template
Blank Pie Chart
Circle with light segment guides.
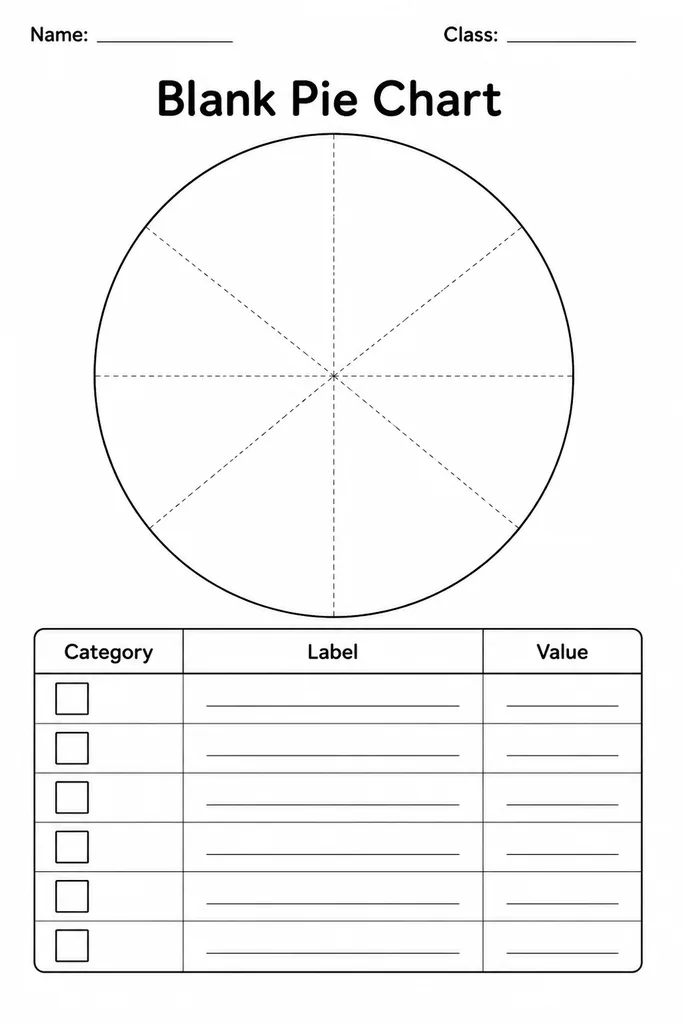
The blank pie chart template features a large pre-drawn circle with faint segment guide lines radiating from the centre, helping students in grades 4–8 create accurate, evenly divided charts without needing a compass or protractor from scratch. Designed for representing part-to-whole relationships, it suits any lesson where students need to show how a total breaks into categories—class survey results, budget allocations, time-management breakdowns, or nutritional data from a science unit. Teachers print one per student or per group; the generous circle size leaves plenty of room for labelling each slice directly on the page or in an adjacent colour-coded key.
Learning objectives
- Represent proportional data as segments of a whole circle
- Convert percentages or fractions into approximate segment sizes
- Label and colour-code pie chart sections clearly
- Interpret part-to-whole relationships in a data set
- Compare relative sizes of different categories visually
- Communicate statistical findings through a clear diagram
How to use this template
- Download and print the blank pie chart template; the guide lines help estimate even divisions.
- Count your total data and calculate what fraction or percentage each category represents.
- Lightly mark the approximate boundary of each segment using the printed guide lines.
- Colour each segment a distinct colour and write the category name and value or percentage.
- Add a title and, if preferred, a colour-coded legend beside the circle.
Classroom & home ideas
- Survey the class on favourite school subjects and create a pie chart of the results.
- Use nutritional information on a food label to graph macronutrient proportions.
- Create a time-pie showing how a character in a novel spends their day, as a reading comprehension activity.
- In a social studies lesson, show land-use distribution for a country studied.
- Have groups each make a pie chart of different countries' world population share and compare them.
Skills practised
Frequently asked questions
Do students need a protractor to use this template?
Not for rough estimates. The faint guide lines divide the circle into approximate sections. For precision work in grades 7–8, students can use the guides as starting points and refine with a protractor.
How many segments can the circle hold clearly?
Up to 6–8 segments remain legible. For more categories, consider grouping smaller values into an 'Other' slice to keep the chart readable.
What if my data doesn't split into equal parts?
That's the point—real data rarely does. Students estimate the boundary between guide lines to represent their specific percentages, practising proportional reasoning in the process.
Can this template be used for fractions lessons rather than data?
Yes. It works equally well for showing equivalent fractions or comparing part-whole relationships using coloured segments, making it a flexible maths manipulative.
Likes & comments
See what other teachers think and share a helpful note.
Create more worksheets in our Worksheet Studio
Generate fresh worksheets for any grade, topic, and language — free.
Open the Worksheet StudioRelated worksheets

Triangular / Tessellation Grid
Frequency Table Template
Fraction Wall (Blank)
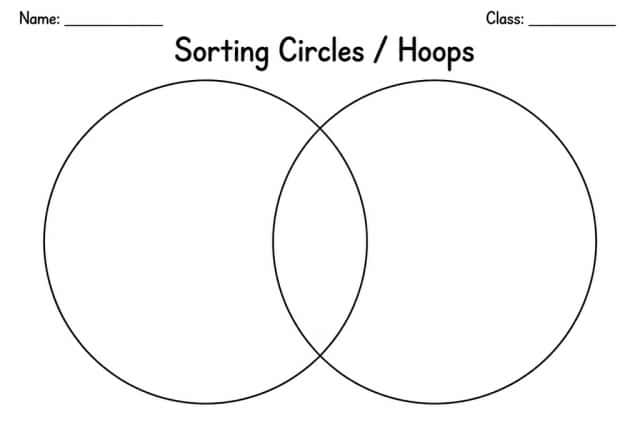
Sorting Circles / Hoops
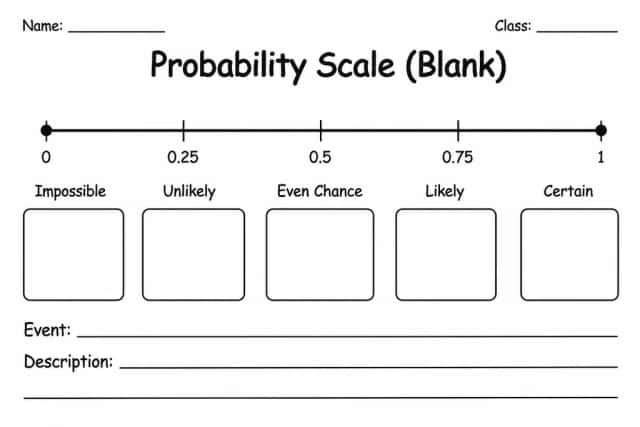
Probability Scale (Blank)
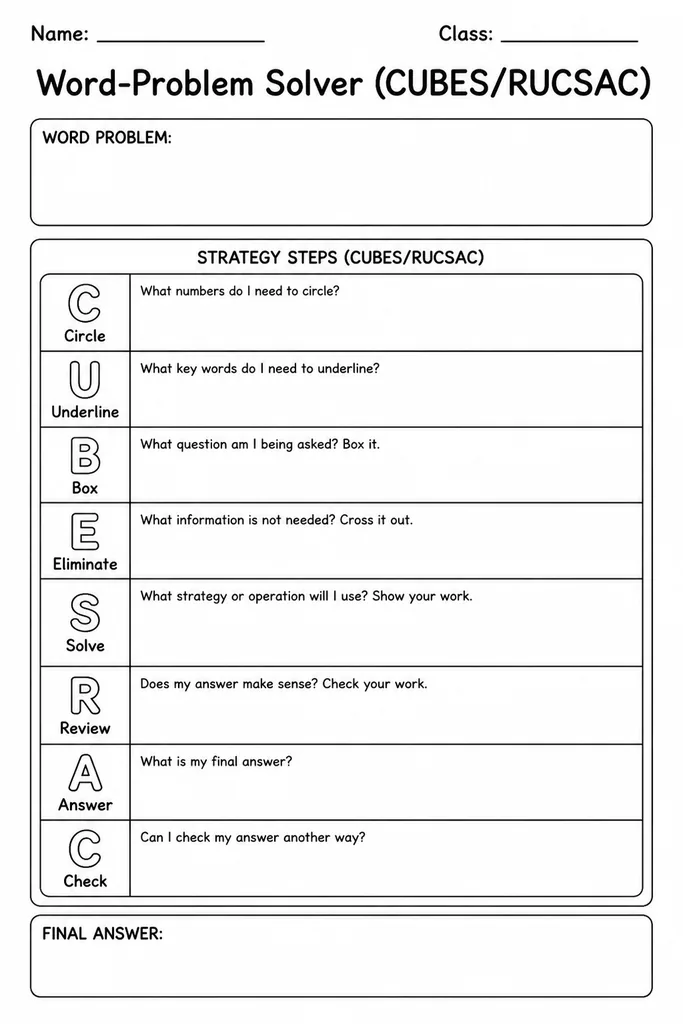
Word-Problem Solver (CUBES/RUCSAC)
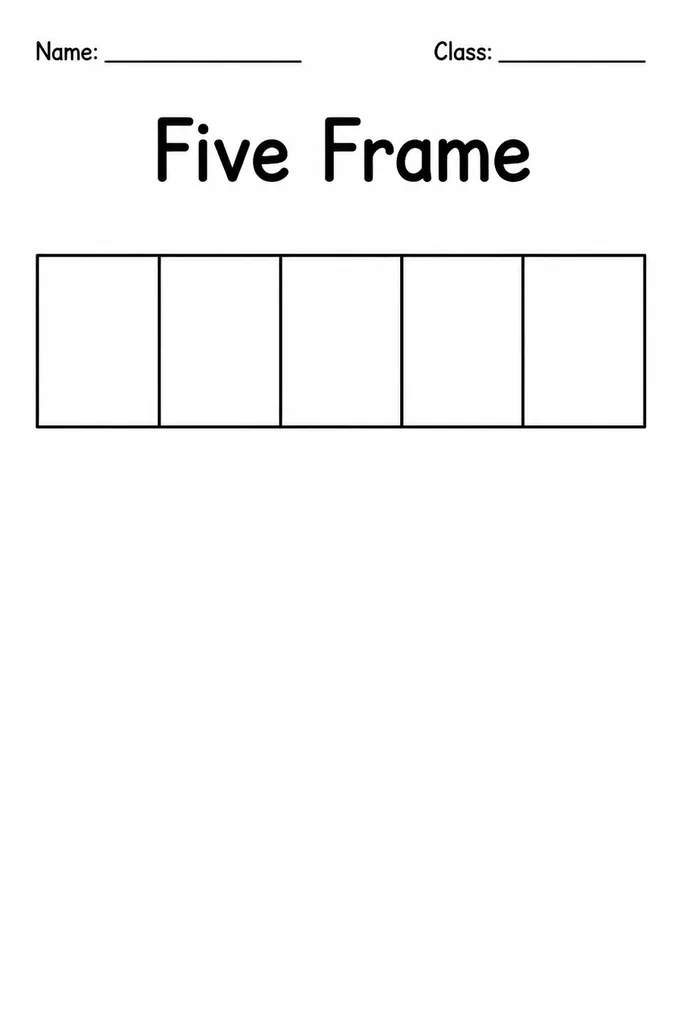
Five Frame