Printable template
Polar Graph Paper
Concentric-circle graph page.

Polar Graph Paper features a series of evenly spaced concentric circles crossed by radial lines emanating from a central pole, creating the circular coordinate system used in advanced mathematics. Students in grades 6–8 use it to plot polar coordinates, explore circular symmetry, graph trigonometric patterns, and visualize concepts that rectangular grids cannot capture cleanly. The blank template lets learners practice converting between polar and rectangular forms, sketch rose curves, or map angles without the friction of drawing circles by hand. Teachers use this paper during geometry units on circles, arc length, and angles, as well as in pre-algebra and pre-calculus introductions to non-rectangular coordinate systems. Art-integrated STEM projects also benefit from the radial layout, since students can create mathematically precise mandalas or symmetrical designs by following the printed circles and angle lines.
Learning objectives
- Plot polar coordinates (r, θ) accurately using concentric circles and radial lines
- Visualize angular measurement and radius in a circular coordinate system
- Convert between polar and rectangular coordinate representations
- Explore symmetry, patterns, and periodic functions in a radial layout
- Support STEM art projects involving circular or radial symmetry
- Introduce non-rectangular graphing as a bridge to advanced mathematics
How to use this template
- Download the free printable PDF and print on letter paper — the concentric circles and radial lines are pre-drawn.
- Identify the pole (center point) and the polar axis (the reference line, typically pointing right).
- Mark each point by moving the correct radius distance along the angle θ from the polar axis.
- Connect plotted points to sketch curves, spirals, or symmetrical figures.
- Label each point or curve with its polar equation or coordinate for reference.
Classroom & home ideas
- Plot a set of polar coordinates that together form a recognizable rose curve or limaçon for visual impact.
- Have students use the radial lines to practice measuring angles in degrees and converting to radians.
- Integrate with art class: students design a symmetrical mandala by repeating a shape across each angular segment.
- Assign a compare-and-contrast task — graph the same data on polar and rectangular grids and discuss the difference in appearance.
- Use as a clock-face study aid: mark hours as angles and radii to reinforce degree measurement.
Skills practised
Frequently asked questions
What angle increments are marked on the polar grid?
The standard version marks radial lines every 15 degrees (24 lines total), giving students common reference angles like 30°, 45°, 60°, 90°, and so on around the full 360°.
How many concentric circles does the template include?
Most versions include eight to ten evenly spaced circles, providing enough radial distance to plot a variety of functions and coordinate pairs at different magnitudes.
Is polar graph paper appropriate for grade 6?
Yes for introductory explorations of angles, circles, and symmetry — even if formal polar coordinate notation comes later. Many teachers use it in geometry units well before pre-calculus.
Can I use this for a compass-and-straightedge geometry project?
Absolutely. The concentric circles serve as precise radius guides, making it a great companion for construction activities that involve arcs and circles.
Likes & comments
See what other teachers think and share a helpful note.
Create more worksheets in our Worksheet Studio
Generate fresh worksheets for any grade, topic, and language — free.
Open the Worksheet StudioRelated worksheets

Triangular / Tessellation Grid
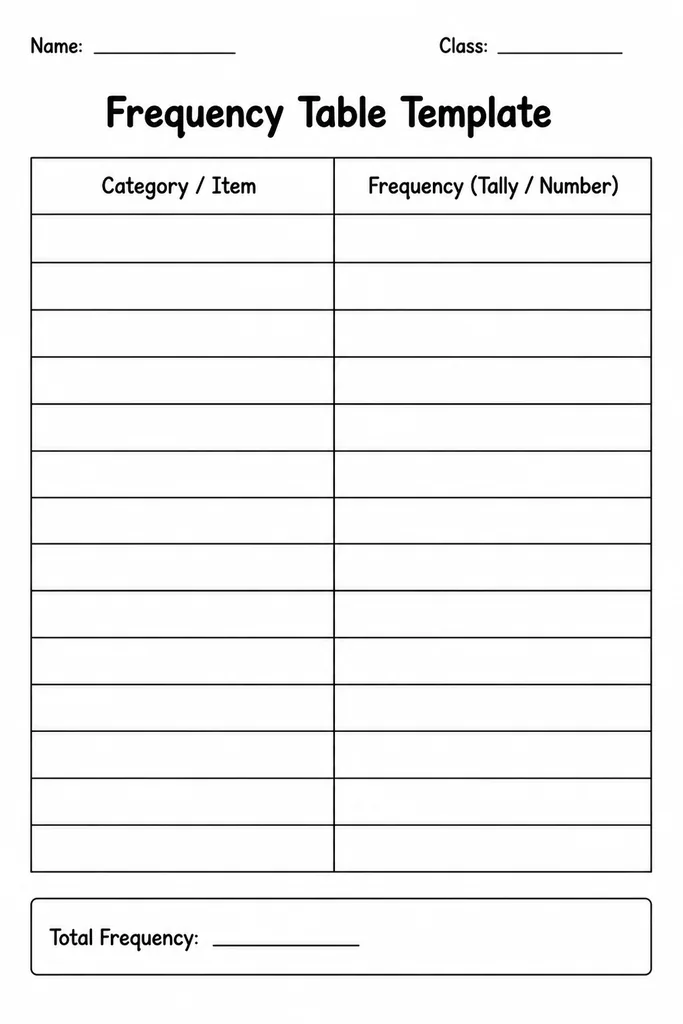
Frequency Table Template
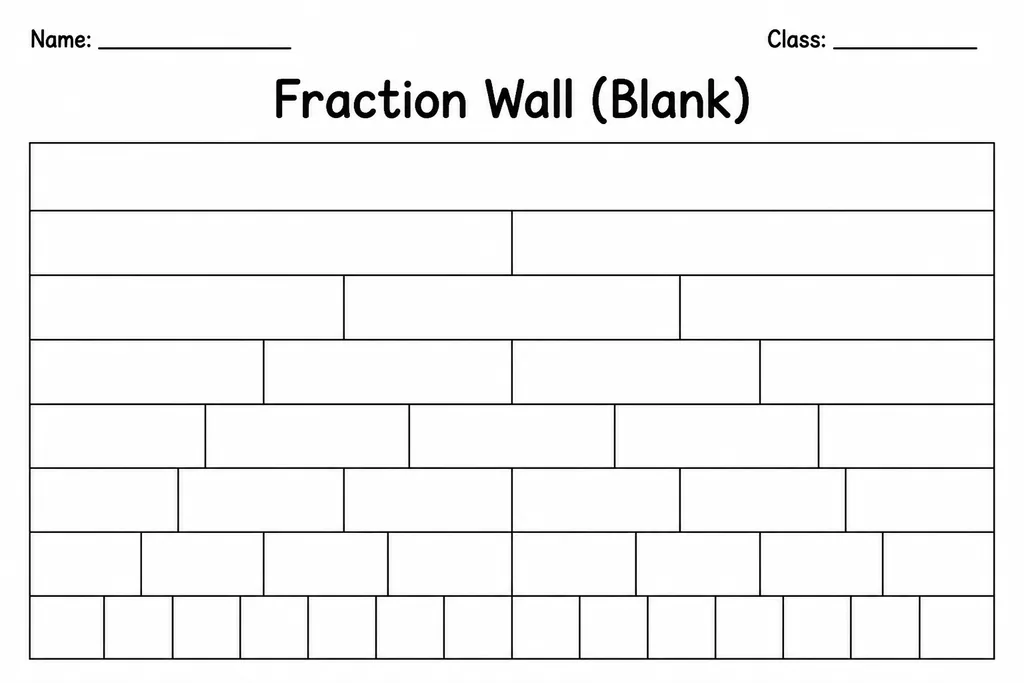
Fraction Wall (Blank)
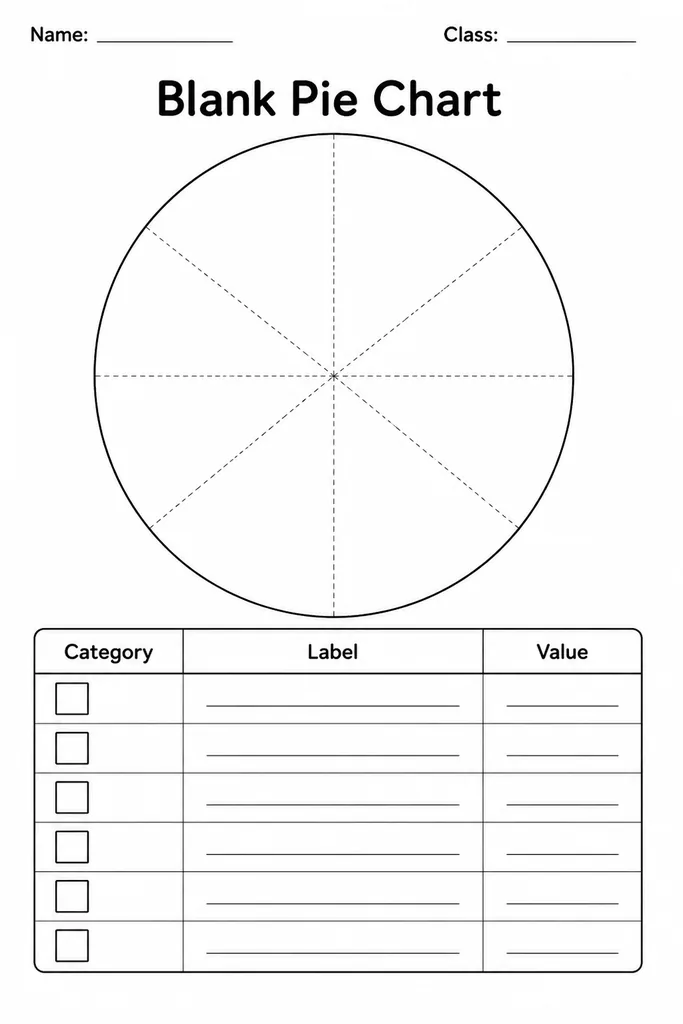
Blank Pie Chart
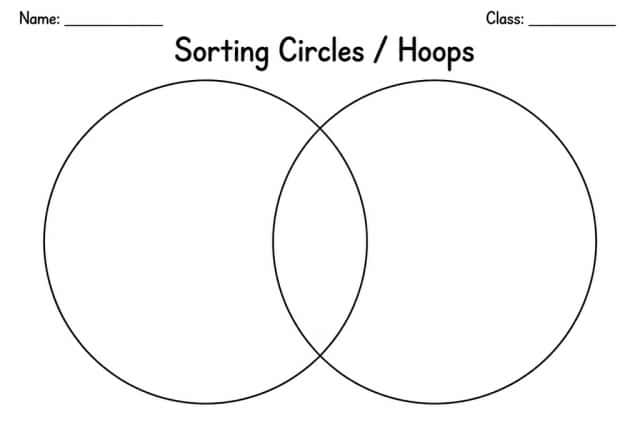
Sorting Circles / Hoops
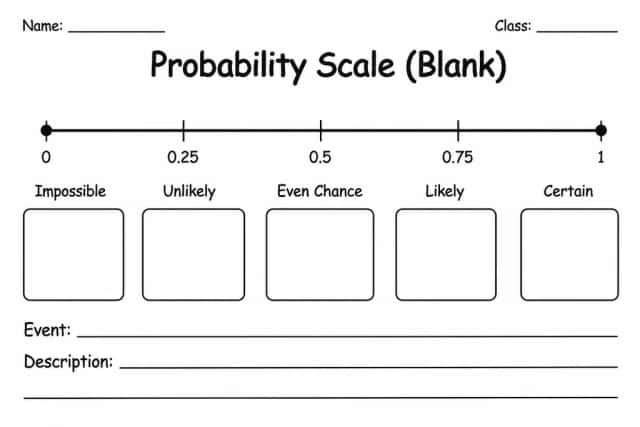
Probability Scale (Blank)
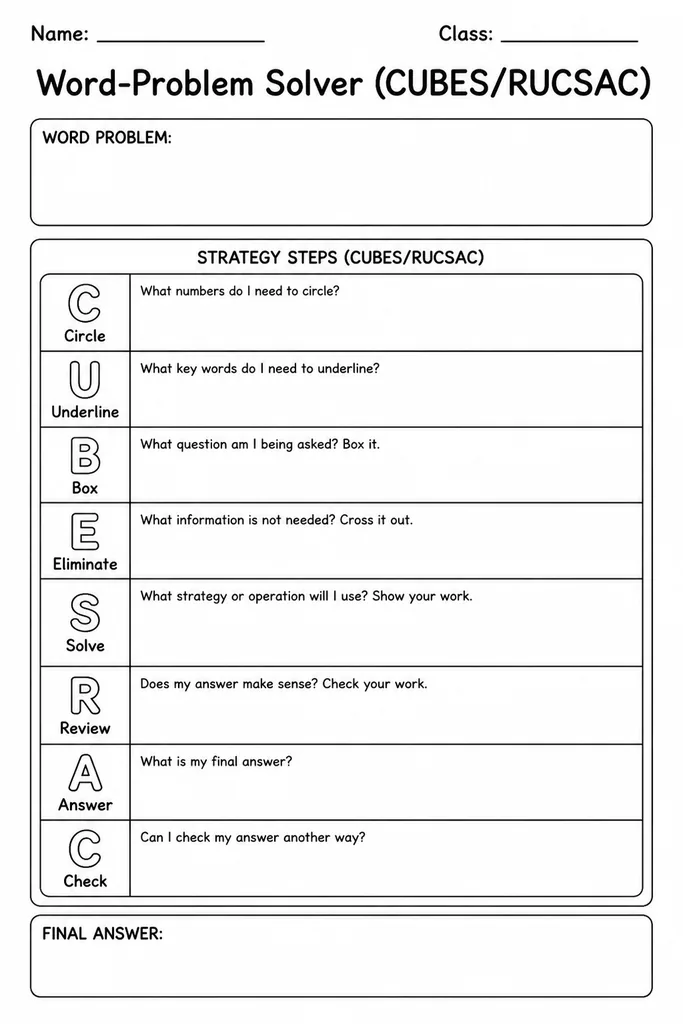
Word-Problem Solver (CUBES/RUCSAC)