Printable template
Place Value Chart with Decimals
Columns through thousandths, blank.
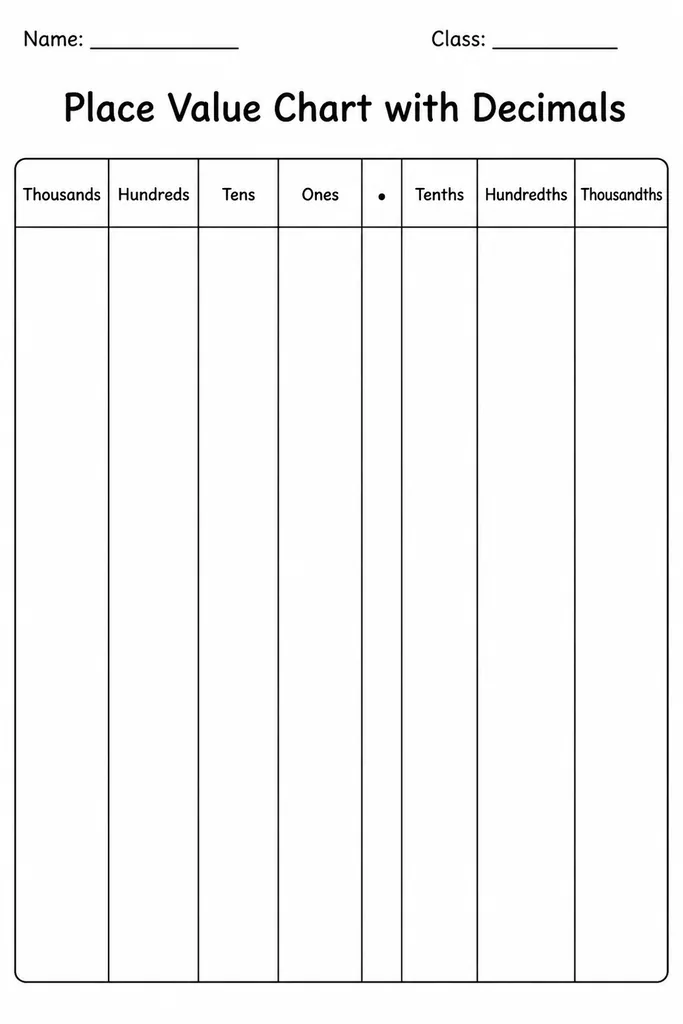
The Place Value Chart with Decimals extends the standard whole-number column layout to include decimal places, spanning from the thousands column on the left all the way through tenths, hundredths, and thousandths on the right, with the decimal point clearly marked between ones and tenths. Students in grades 4–8 use it to record, compare, and compute with decimal numbers, making abstract decimal notation visually concrete. The blank cells let students write any value they choose, making the chart equally useful for a quick demonstration or a formal assessment scaffold. Science and math teachers both find it valuable: decimals appear in measurement, money, and data contexts across the curriculum. Print a single reference copy per student to keep in their binder, or distribute fresh copies whenever a new decimal operation is introduced.
Learning objectives
- Correctly place digits in decimal columns from thousandths to thousands
- Read and write decimal numbers up to three decimal places
- Compare and order decimals using column alignment as a visual aid
- Support decimal addition and subtraction by aligning digits precisely
- Identify the role of the decimal point as the boundary between whole and fractional parts
- Connect decimal notation to fractions and metric measurement contexts
How to use this template
- Download and print the multi-column decimal chart on letter paper, oriented landscape for the widest column spread.
- Locate the decimal point marker in the centre and identify the ones column immediately to its left.
- Write each digit of the target number in its correct column, starting from the leftmost non-zero digit.
- Use the chart to align two decimal numbers for comparison or column arithmetic—one number per row.
- Highlight or circle the decimal point column each time to reinforce its fixed position in the layout.
Classroom & home ideas
- Record metric measurements from a science experiment (e.g., 1.350 g, 0.075 L) and discuss what each digit's column tells you about the precision of the measurement.
- Compare supermarket prices to the thousandth (petrol prices, unit costs): write both values on the chart and identify which column shows the difference.
- Line up three students' decimal quiz scores on separate rows and order them from highest to lowest using the column alignment as the reasoning tool.
- Introduce rounding by covering the thousandths column with a finger and deciding whether the hundredths digit rounds up or stays—visible on the chart.
- Use during a money unit: decompose dollar amounts into dollars (ones/tens), dimes (tenths), and cents (hundredths) in the matching columns.
Skills practised
Frequently asked questions
How many columns does this chart include?
The template includes seven columns: Thousands, Hundreds, Tens, Ones, Tenths, Hundredths, and Thousandths, with a clearly printed decimal point between Ones and Tenths.
Is this suitable for grade 4 students just starting decimals?
Yes. Start with only the Ones, Tenths, and Hundredths columns for grade 4. The extra columns are there for when students progress; there is no obligation to use every column in early lessons.
How does this chart differ from the basic Place Value Chart (H-T-O)?
The basic chart covers whole numbers to 999 and is suited for grades 1–5. This decimal version extends the range to thousands on the left and thousandths on the right, making it the right tool for grade 4 and up when decimals appear in the curriculum.
Can I use this chart for scientific notation work?
The chart helps students understand the decimal positions that underpin scientific notation, but it does not include an exponent row. It works best as a conceptual bridge before formal scientific notation instruction.
Likes & comments
See what other teachers think and share a helpful note.
Create more worksheets in our Worksheet Studio
Generate fresh worksheets for any grade, topic, and language — free.
Open the Worksheet StudioRelated worksheets

Triangular / Tessellation Grid
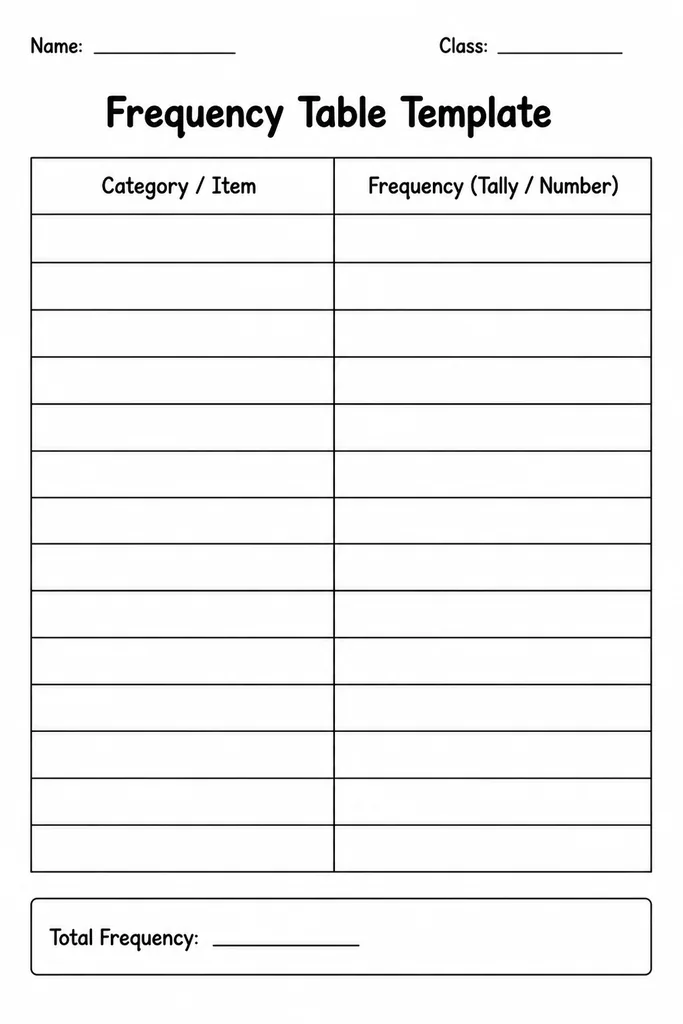
Frequency Table Template
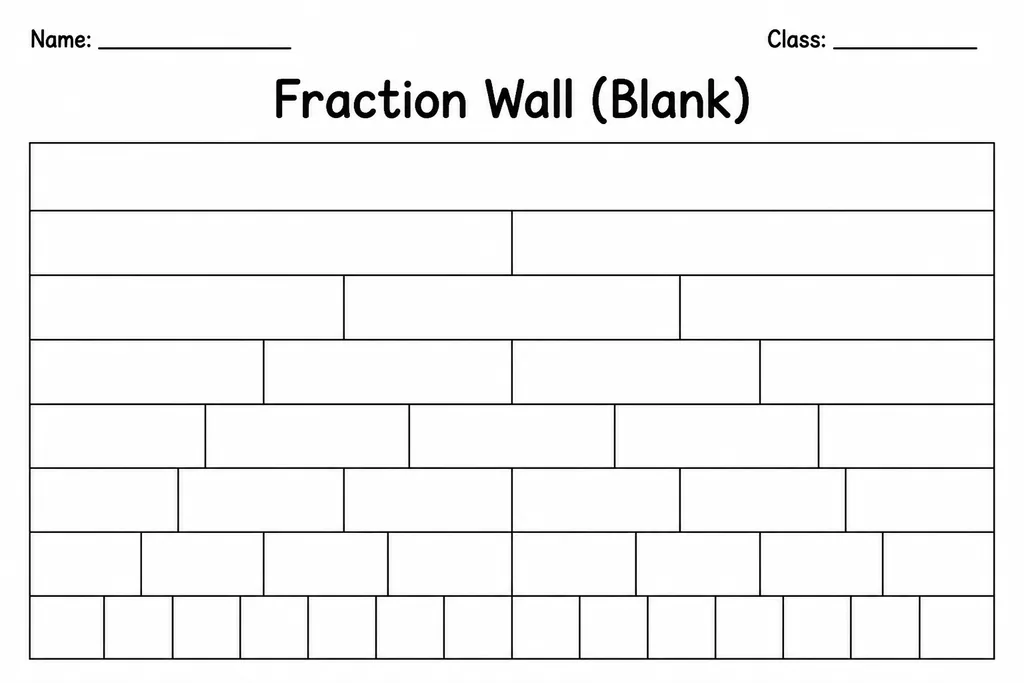
Fraction Wall (Blank)
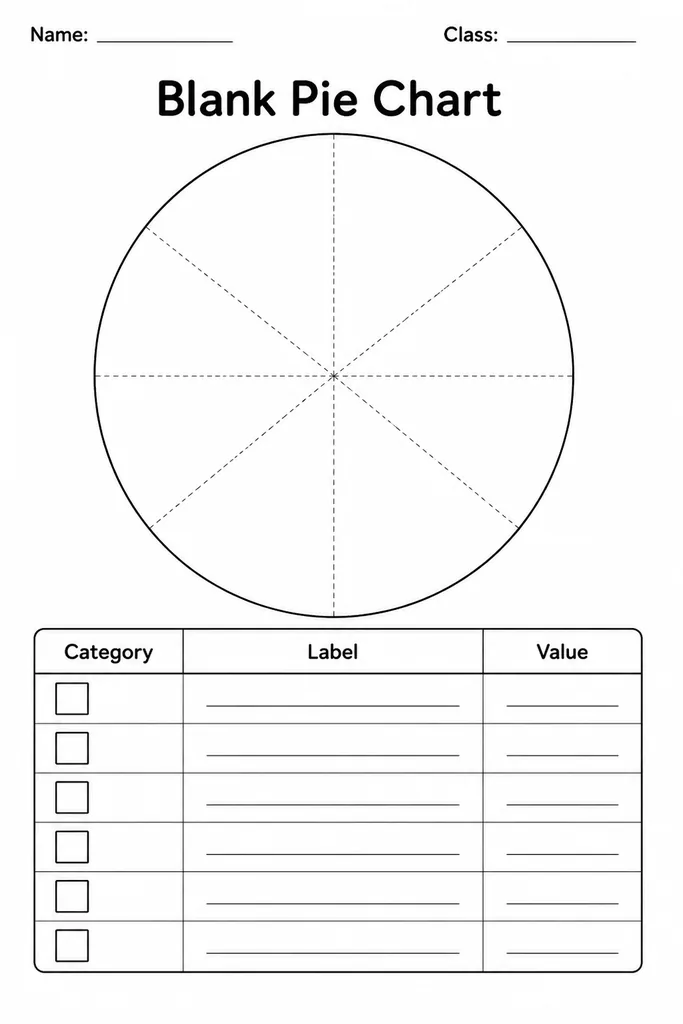
Blank Pie Chart
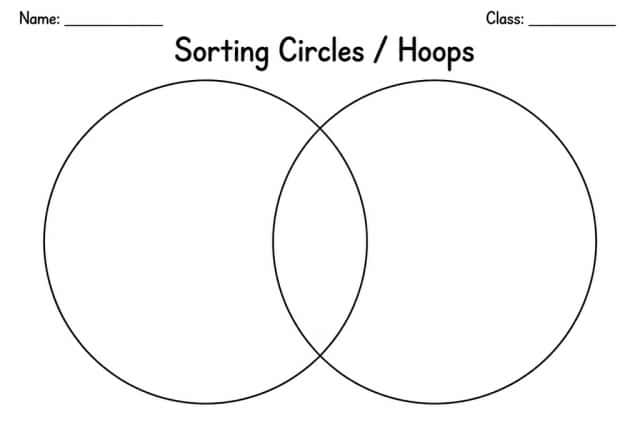
Sorting Circles / Hoops
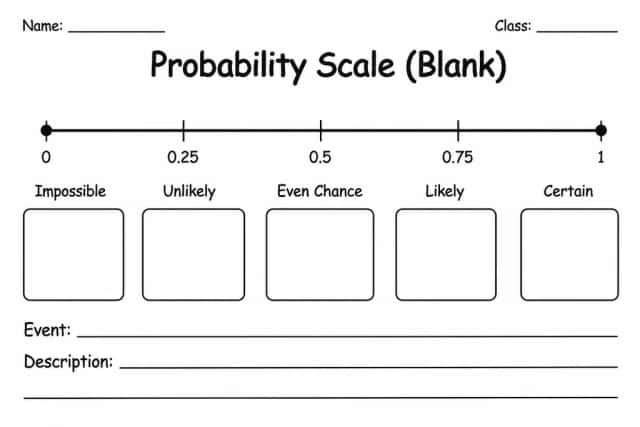
Probability Scale (Blank)
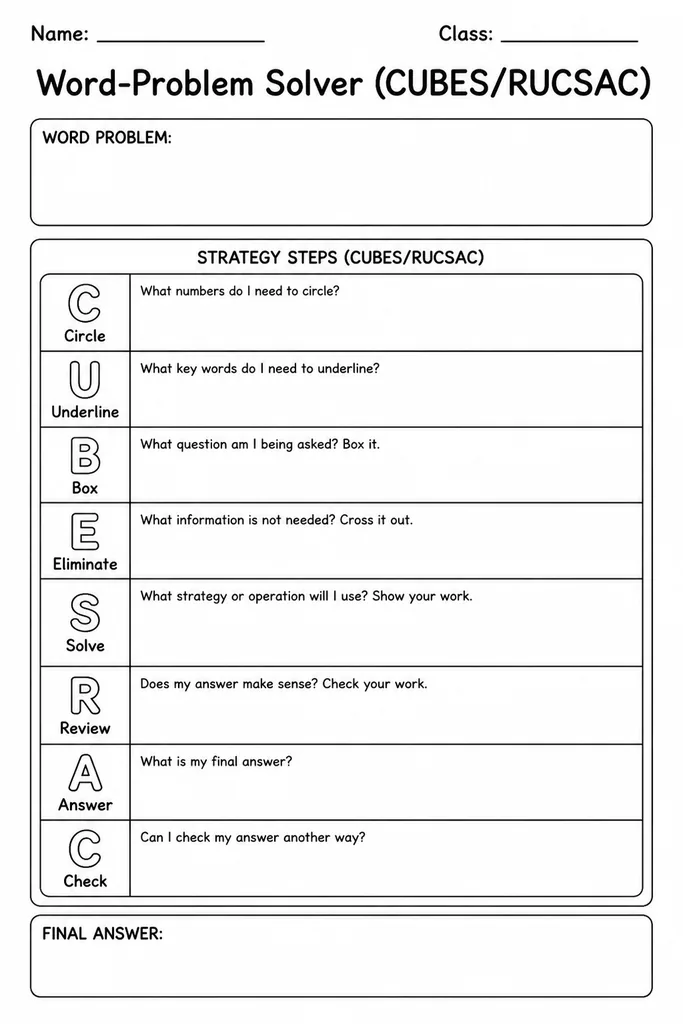
Word-Problem Solver (CUBES/RUCSAC)