Printable template
Blank Pictograph
Rows plus key, blank.
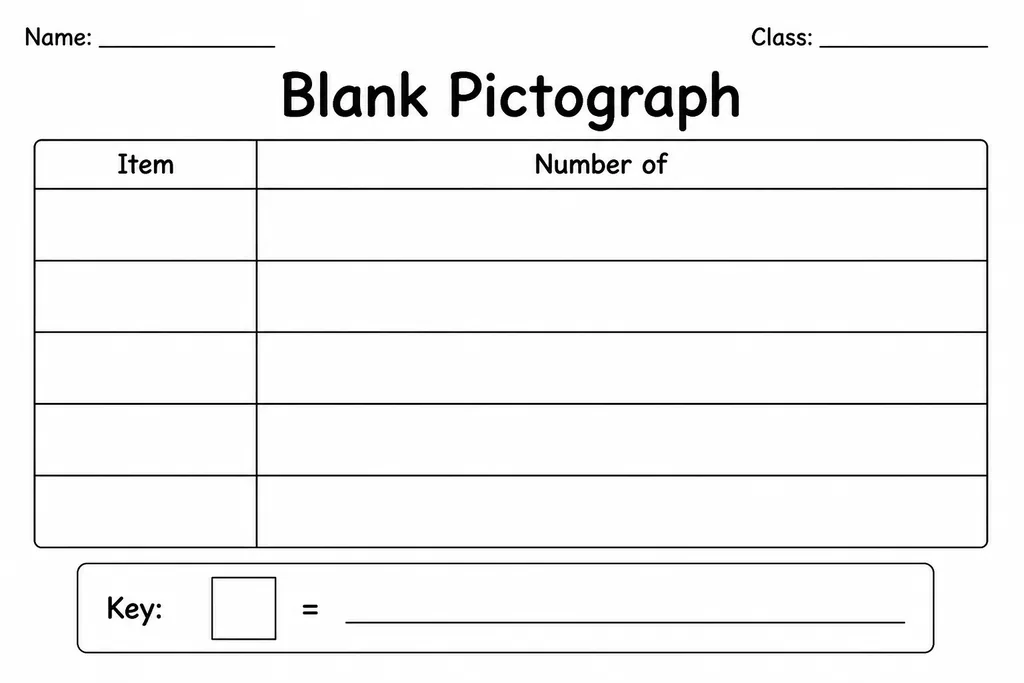
A blank pictograph template gives students a ready-made grid of labelled rows and a dedicated key box, so they can focus entirely on choosing a symbol and recording data rather than drawing lines. Designed for grades 1–4, it suits counting activities where pictures represent quantities—each apple drawn might stand for two pieces of fruit eaten, each star for five correct answers. Teachers hand it out during data-collection lessons; students bring it home for simple surveys. The pre-printed row structure keeps young learners organised while they practise early graphing concepts, and the spacious key area makes it easy to define the value of each picture before filling in the rows.
Learning objectives
- Represent data sets using a chosen picture symbol
- Understand and define a pictograph key or legend
- Count and compare quantities shown pictorially
- Match one-to-one or many-to-one correspondence
- Read and interpret a completed pictograph
- Connect data collection to real-world observations
How to use this template
- Download and print the blank pictograph on standard letter or A4 paper.
- Write a title and label each row with a category (e.g. favourite fruit, pet type).
- Draw or stamp your chosen symbol in the key box and write how many it stands for.
- Fill each row by drawing the correct number of symbols to match your data.
- Reuse by laminating the sheet and using dry-erase markers for repeated data activities.
Classroom & home ideas
- Conduct a class favourite-colour vote and have each student fill in one row with the results.
- Track daily weather over a week and use a sun or cloud symbol to record each day's type.
- Send it home as a family survey—students tally siblings, pets, or rooms in the house.
- Pair with a read-aloud where characters collect objects; students pictograph the totals.
- Use in a maths centre rotation where each group surveys a different topic and compares graphs.
Skills practised
Frequently asked questions
What age group is this blank pictograph best suited for?
It works best for grades 1–4 (ages 6–10). Younger students use one-to-one correspondence; older students can assign a value of 2 or 5 to each symbol as they grow more confident.
How many rows does the template have?
The sheet includes 5 labelled rows plus a key box at the bottom, giving enough space for a typical 3–5 category data set without feeling cramped.
Can students use stickers instead of drawing symbols?
Absolutely. Small dot stickers, star stickers, or themed stickers work perfectly and keep the pictograph neat for students who find drawing difficult.
Is there a digital version for Google Classroom?
The download is a print-ready PDF. For digital use, import it into Google Slides or Canva as a background image and type or insert shapes over it.
Likes & comments
See what other teachers think and share a helpful note.
Create more worksheets in our Worksheet Studio
Generate fresh worksheets for any grade, topic, and language — free.
Open the Worksheet StudioRelated worksheets

Triangular / Tessellation Grid
Frequency Table Template
Fraction Wall (Blank)
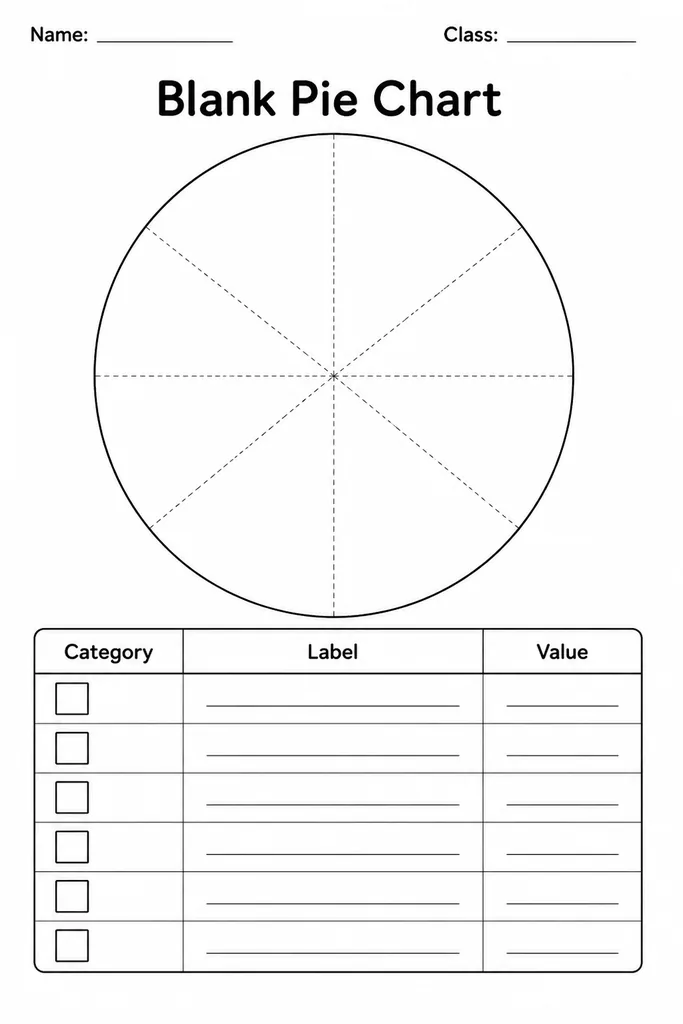
Blank Pie Chart
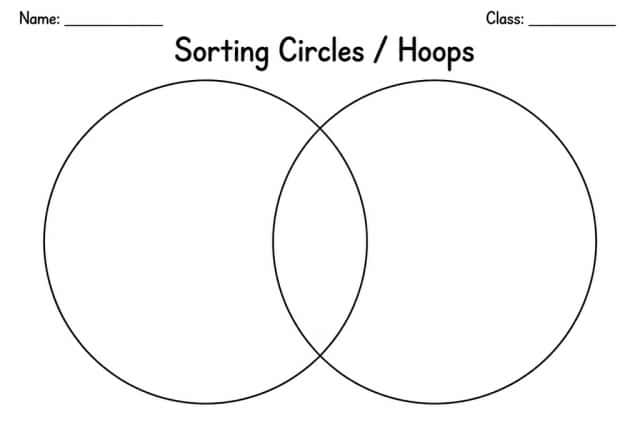
Sorting Circles / Hoops
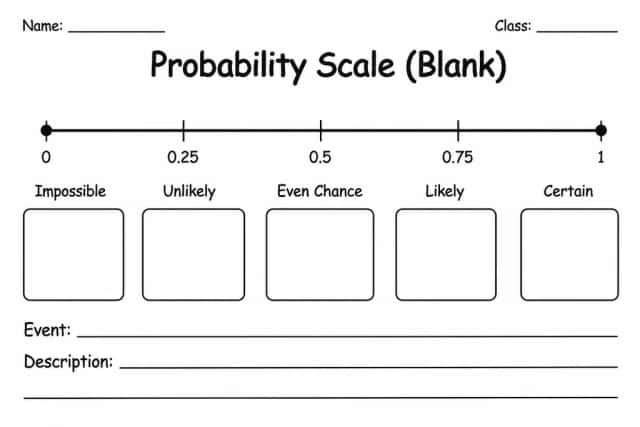
Probability Scale (Blank)
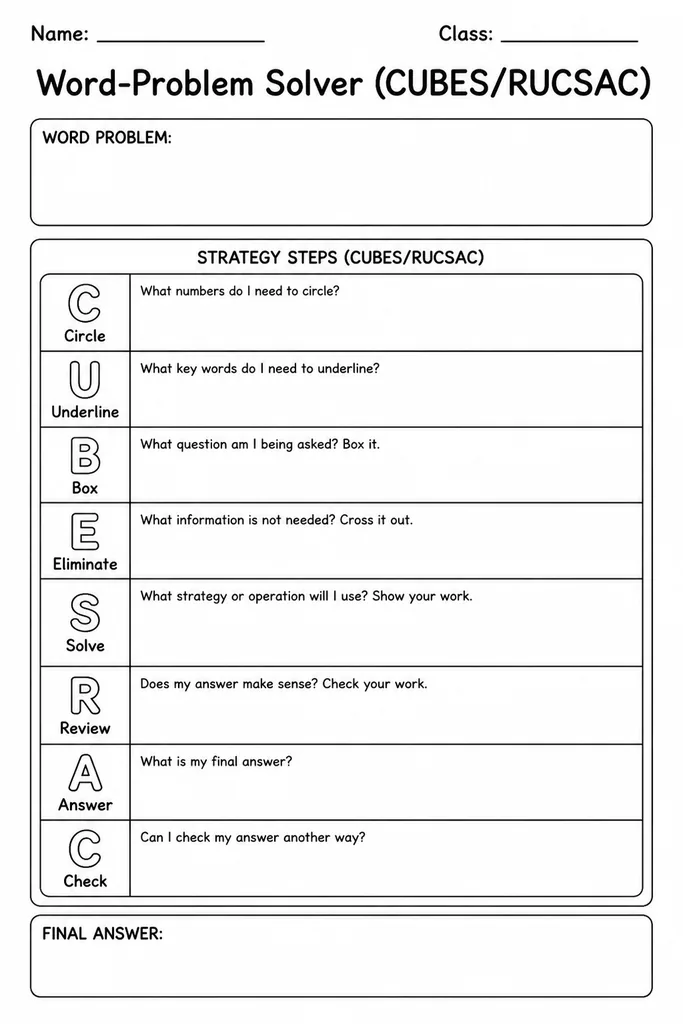
Word-Problem Solver (CUBES/RUCSAC)