Printable template
Blank Bar Chart
Axes and gridlines, no data.
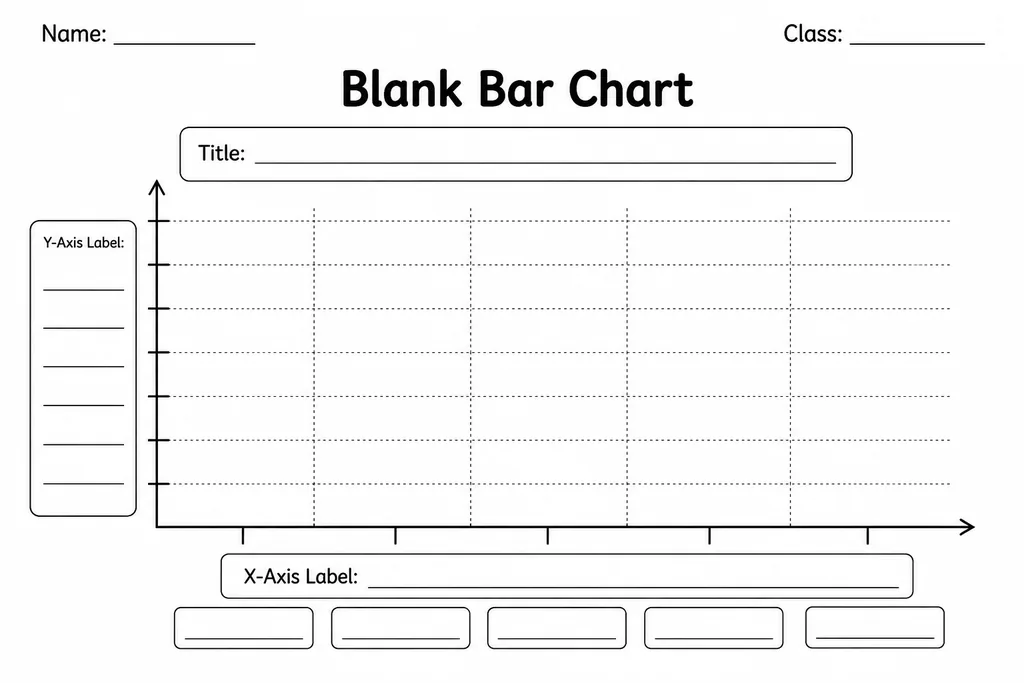
A blank bar chart template provides a pre-drawn set of axes and evenly spaced gridlines with no data, labels, or scale—leaving every element for the student to supply. Grades 1–6 students use it to record survey results, science observations, and class data by drawing bars to the appropriate height and labelling both axes themselves. Because the structure is already in place, learners can focus on the mathematical decisions: choosing a scale, spacing categories, and reading values off the grid. Teachers reach for this template in data and statistics lessons, science units, and cross-curricular projects where students collect their own information. A grade 1 class might count classroom objects and plot totals; a grade 6 class might graph survey data about screen time and interpret the distribution. Parents find it handy for science fair projects and home experiments, giving children a tidy, professional-looking chart to complete without requiring graph-paper skills.
Learning objectives
- Choose an appropriate scale and label both axes clearly
- Represent categorical and numerical data accurately as proportional bars
- Read and interpret bar heights to answer comparison and total questions
- Understand that chart titles and axis labels communicate context to any reader
- Connect data collection to visual display and back to real-world meaning
- Distinguish between vertical (column) and horizontal bar chart layouts
How to use this template
- Collect or receive a data set—survey results, measurement readings, or tally counts—and decide on categories for the horizontal axis.
- Choose a scale for the vertical axis based on the highest value in the data; label the y-axis with evenly spaced numbers and write a unit label.
- Write a category label below each bar position on the x-axis and add a descriptive title above the chart.
- Draw each bar from the baseline to the correct height, using the gridlines as a guide for accuracy.
- Add colour or shading to each bar (different colours for different categories or one colour for one variable) to improve readability.
Classroom & home ideas
- Favourite subject survey: students poll classmates, tally results, then plot the counts as bars—linking data collection, tallying, and graphing in one connected activity.
- Science experiment results: after a plant-growth experiment, students measure stem heights weekly and plot each week's reading as a new bar in a grouped bar chart.
- Weather unit: record daily temperatures or rainfall for one month; students draw one bar per day to build a time-series bar chart and identify the warmest or wettest week.
- Book genre tracking: keep a class reading log for a month; at month end, students plot how many books were read in each genre and write two observations about the distribution.
- Comparing two groups: provide a template with pairs of adjacent columns so students can compare two classes' quiz scores or two weeks of step counts side by side.
Skills practised
Frequently asked questions
What scale increments should I suggest to younger students?
For grades 1–2, scales counting by 1s or 2s work well. Grades 3–4 can handle 5s and 10s. Grades 5–6 should be guided to choose the scale themselves based on the data range, rounding up to a convenient maximum.
Should bars be vertical or horizontal on this template?
The standard blank bar chart template uses vertical bars (column chart). A horizontal version—where bars extend right from a vertical axis—is better for long category names. Both are printable from the same download.
Can this template handle grouped (side-by-side) bar charts?
The basic template suits simple bar charts. For grouped bars, widen the column spacing and pencil in dividing lines inside each group's space. A dedicated grouped-bar template makes this easier for younger students.
How do I help students who draw bars that do not align with the grid?
Have students use a ruler along the top edge of each bar and check alignment with the nearest gridline before lifting the pencil. Modelling this with a think-aloud on the document camera prevents most errors.
Likes & comments
See what other teachers think and share a helpful note.
Create more worksheets in our Worksheet Studio
Generate fresh worksheets for any grade, topic, and language — free.
Open the Worksheet StudioRelated worksheets

Triangular / Tessellation Grid
Frequency Table Template
Fraction Wall (Blank)
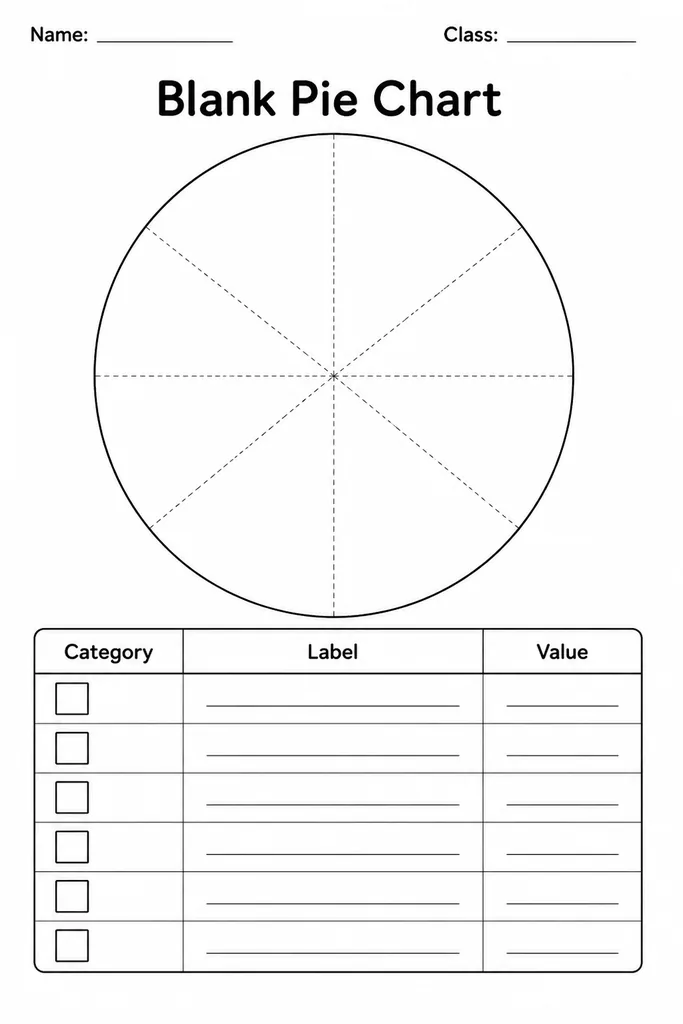
Blank Pie Chart
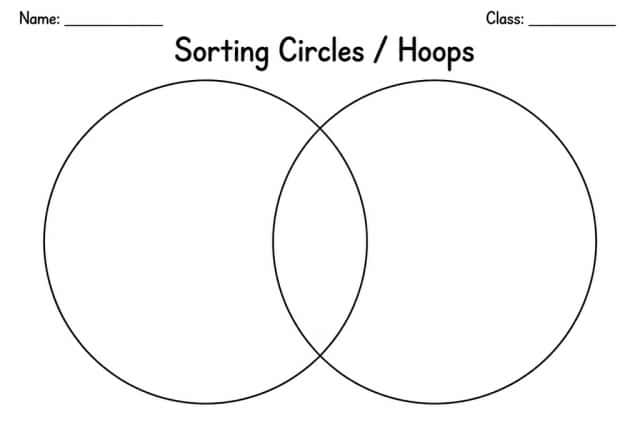
Sorting Circles / Hoops
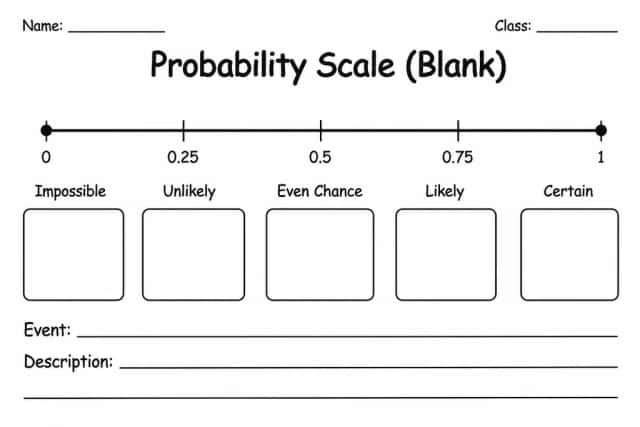
Probability Scale (Blank)
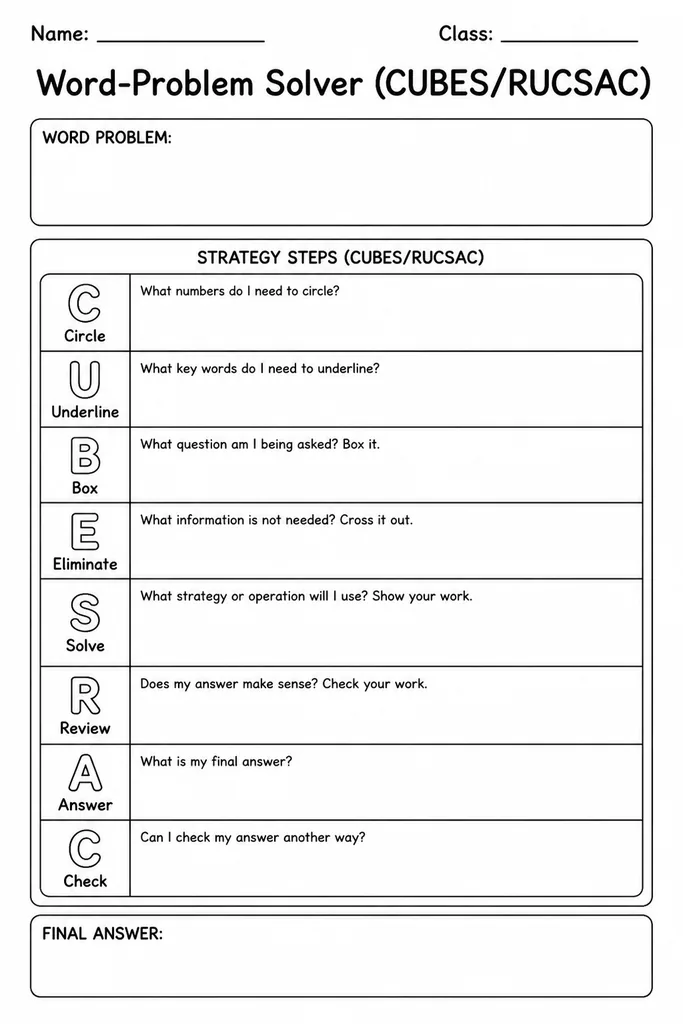
Word-Problem Solver (CUBES/RUCSAC)