Printable template
Cycle Diagram (Blank)
Empty circular arrow cycle.
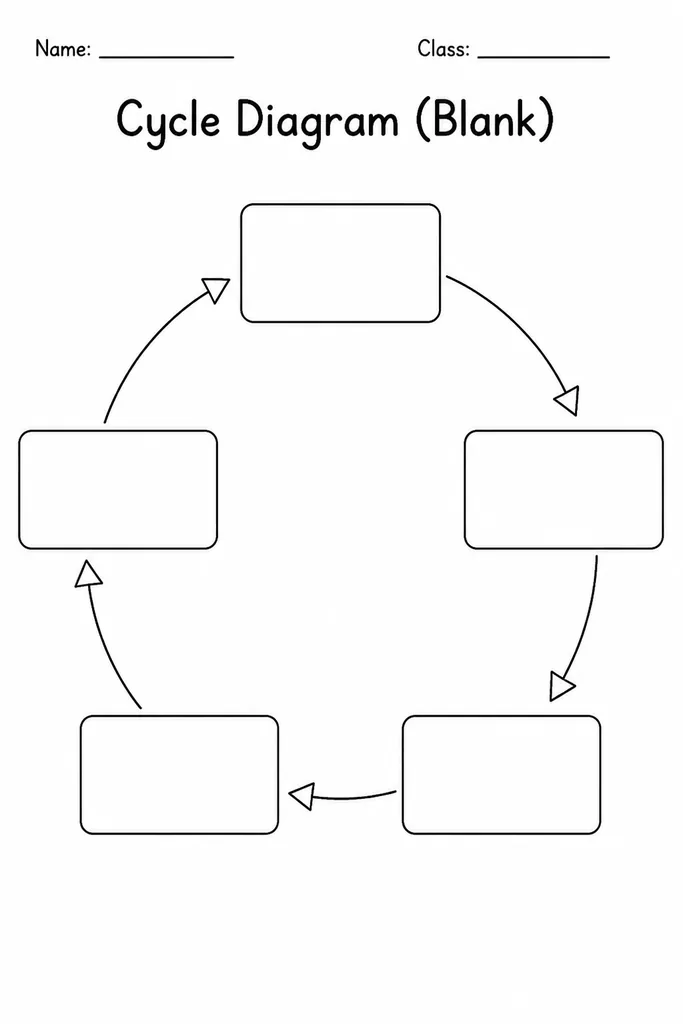
The Cycle Diagram (Blank) is an empty circular-arrow graphic organizer suited for grades 2–8. Its looping arrows visually communicate that a process repeats—making it the go-to template for science cycles (water cycle, rock cycle, life cycles), social studies patterns (trade routes, historical cause-and-effect loops), and even literary analysis of recurring story structures. Students write a stage label and brief description inside each segment, then follow the arrows to see how the final stage connects back to the beginning. Teachers appreciate the blank format because the number of visible segments can be customised by how many labels students add, so the same printable adapts whether a cycle has three stages or six. The template is equally useful for individual seat work, small-group collaboration, or whole-class anchor charts.
Learning objectives
- Visualise and understand repeating processes and natural cycles
- Sequence events or stages in a continuous loop
- Connect cause and effect across multiple cycle stages
- Apply cyclic thinking to science, history, and literature
- Practise labelling and annotating scientific diagrams
How to use this template
- Download and print the blank cycle diagram—one per student or one large copy for group display.
- Write a title for the cycle at the top or centre (e.g., 'Life Cycle of a Frog').
- Label each arrow segment with a stage name and add a short description or quick sketch inside the box.
- Draw or trace connecting arrows if the template uses blank arcs, or simply fill in the pre-printed arrow spaces.
- Review the completed diagram by reading aloud each stage in order, confirming the loop makes logical sense before a quiz or display.
Classroom & home ideas
- Science: complete the water cycle stages (evaporation, condensation, precipitation, collection) after a weather unit.
- Life science: map insect metamorphosis (egg, larva, pupa, adult) for a butterfly or beetle study.
- Social studies: chart the cycle of economic boom and bust, or the stages of a historical revolution.
- ELA: use the cycle diagram to plot the recurring hero's journey structure found across myths and novels.
- Assessment exit ticket: give students a blank diagram and a word bank of stage names, asking them to arrange stages correctly.
Skills practised
Frequently asked questions
How many stages does the blank cycle diagram support?
The template typically accommodates four to six stages. For fewer stages, simply leave segments blank or draw lines through them; for more complex cycles, students can add extra arrows and boxes in the margins.
What's the difference between a cycle diagram and a flow chart?
A flow chart shows a linear process with a clear start and end. A cycle diagram is specifically for processes that loop back to the beginning, such as natural cycles, recurring historical patterns, or continuous manufacturing processes.
Can this be used for non-science subjects?
Yes. History teachers use it for recurring political cycles, ELA teachers for narrative structure analysis, and even math teachers for the cycle of problem-solving steps (understand, plan, solve, check).
Is the blank version better than a pre-filled example?
For learning, the blank version requires students to recall and organise information actively, which improves retention compared to simply reading a pre-filled diagram. Pair it with a pre-filled mentor diagram for struggling learners.
Likes & comments
See what other teachers think and share a helpful note.
Create more worksheets in our Worksheet Studio
Generate fresh worksheets for any grade, topic, and language — free.
Open the Worksheet StudioRelated worksheets
Recount Planner
Speech-Bubble Sheet
Bubble Map
Boxing-Up Planner
Flow Map (Sequence)
Postcard Template
6-Panel Comic Strip