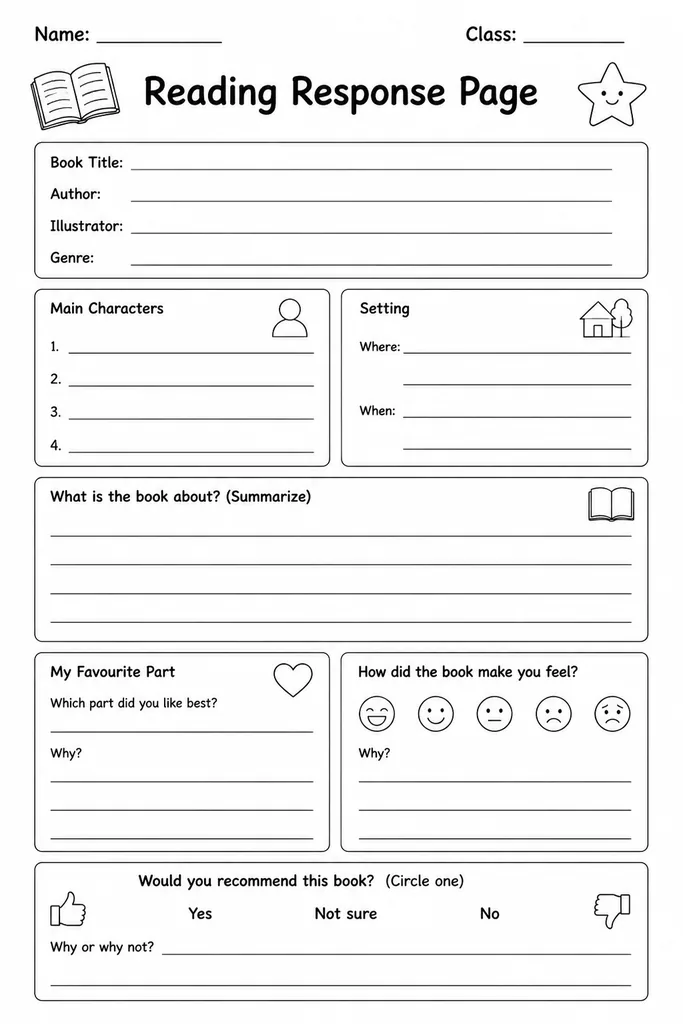
Printable template
Cause and Effect Chart
Linked cause and effect boxes, blank.
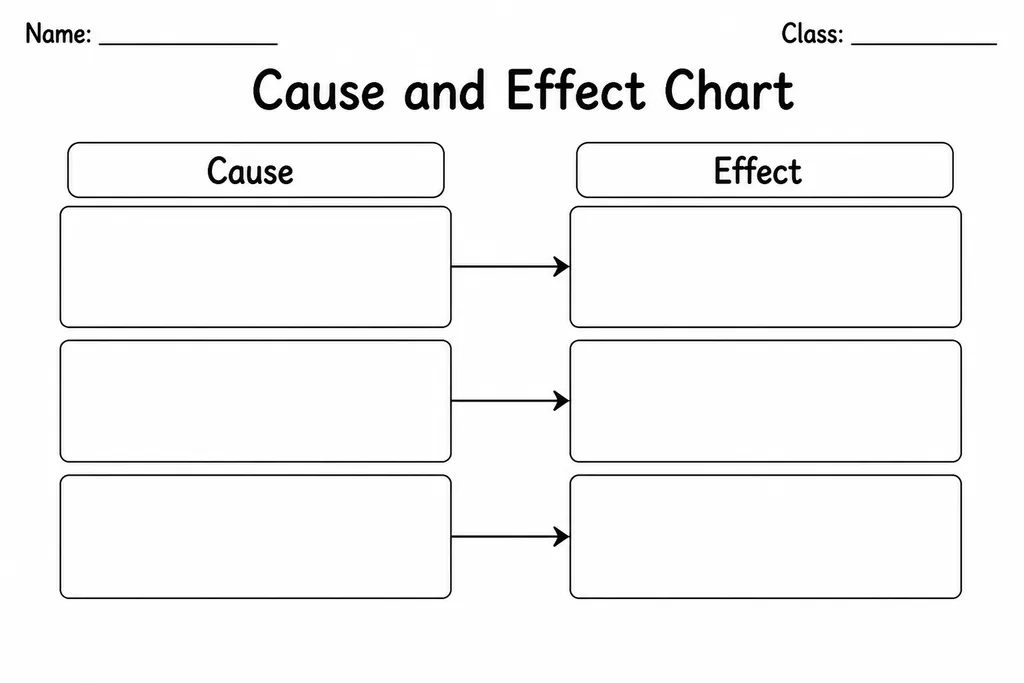
The Cause and Effect Chart presents a pair of linked blank boxes—one for the cause, one for its effect—connected by a clear visual arrow to show the relationship between them. Students in grades 2–8 use it to analyze texts, scientific observations, historical decisions, and story events where one thing leads directly to another. Teachers deploy it during close-reading stops, science lab debrief discussions, and social studies lessons to make abstract causal thinking visible and concrete. It is equally useful for a parent coaching a child to think through why a story character made a choice. The chart supports single cause-effect pairs and can be stacked or chained for more complex analyses. Because the boxes contain no pre-printed prompts beyond "Cause" and "Effect," the same template works for a second-grader explaining why a plant wilted and an eighth-grader analyzing the causes of a historical conflict.
Learning objectives
- Identify causal relationships in texts, experiments, and historical events
- Distinguish between a cause and its resulting effect
- Build analytical thinking before writing an explanatory paragraph
- Practice using causal language: because, as a result, therefore
- Connect evidence from a text to a logical conclusion
- Support science inquiry by documenting variables and outcomes
How to use this template
- Download and print the Cause and Effect Chart—one per student or per event being analyzed.
- Read the text, observe the experiment, or recall the event being examined.
- Write the cause—the action, decision, or condition—in the left box.
- Write the resulting effect in the right box, tracing what happened because of the cause.
- Use the completed chart as a scaffold before writing a cause-and-effect paragraph or essay.
Classroom & home ideas
- Use after reading a chapter of a novel to chart why a character made a key decision and what happened next.
- Assign during a science unit: students record the variable changed (cause) and the outcome measured (effect) from a classroom experiment.
- During a history lesson, have students chart the cause of a major event and its immediate consequences—one chart per group, then share out.
- Use in a health or social-emotional lesson: students chart a feeling or behavior (cause) and its impact on others (effect).
- Give students a completed effect and challenge them to work backward—reading text to find and fill in the cause.
Skills practised
Frequently asked questions
What if there are multiple causes for one effect?
Print additional copies and assign one cause per chart, then group the charts together to show how several factors contributed to a single outcome. Some teachers draw arrows from multiple cause boxes into one shared effect box on a whiteboard.
Can this chart handle a chain of events where the effect becomes a new cause?
Yes. Students complete one chart, then use the effect as the cause on a second chart, creating a chain. This works well for complex historical sequences or multi-step science processes.
Is this chart appropriate for science as well as language arts?
It is specifically useful in science—recording what changed in an experiment and what resulted. The cause-effect structure maps directly onto the independent variable and dependent variable in an experiment.
How do I differentiate this for younger vs. older students?
For grades 2–3, students draw pictures inside each box or write single words. For grades 5–8, expect complete sentences with text evidence cited below each box.
Likes & comments
See what other teachers think and share a helpful note.
Create more worksheets in our Worksheet Studio
Generate fresh worksheets for any grade, topic, and language — free.
Open the Worksheet StudioRelated worksheets
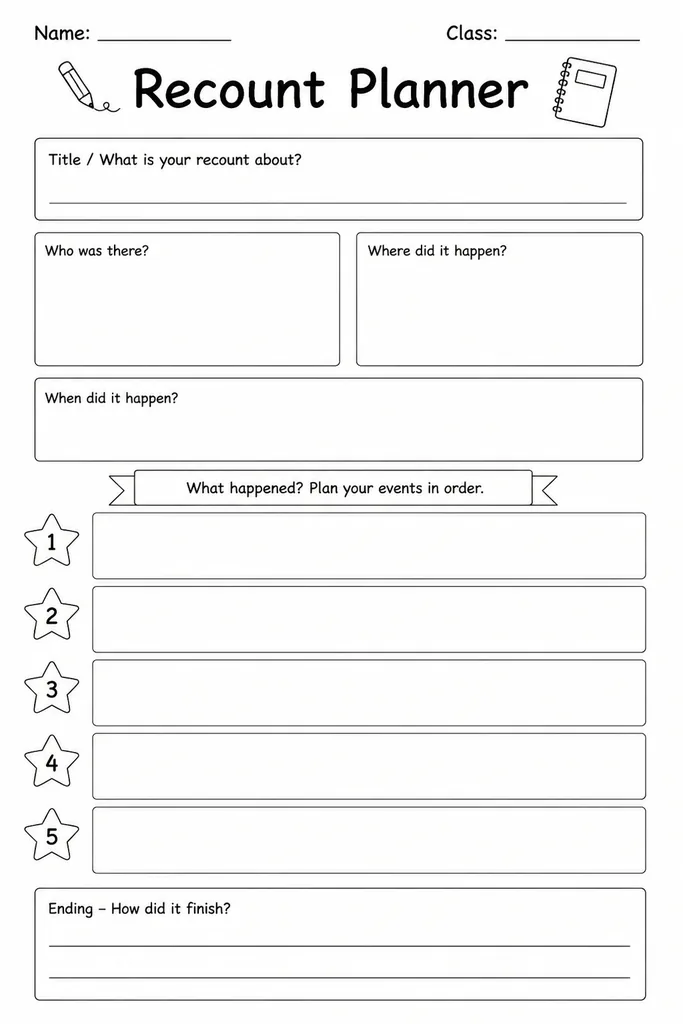
Recount Planner
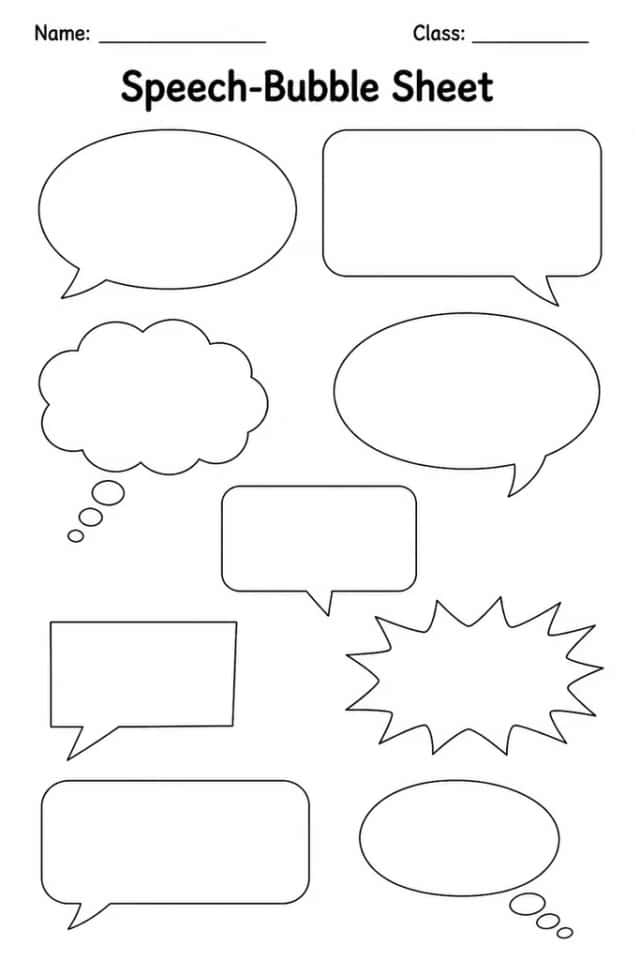
Speech-Bubble Sheet
Bubble Map
Boxing-Up Planner
Flow Map (Sequence)
Postcard Template
6-Panel Comic Strip