
Approximate the area under a curve with strips and choose how each takes its height: left edge, right edge, middle, or a sloping top. Push the strip count up and watch the error fall, with the running total plotted as its own curve.
—
KiwiBee 使用 Google Analytics、Google Ads 及 Meta Pixel 的可選 Cookie,以了解成年訪客、統計已完成的註冊及改善推廣活動。必要 Cookie 會一直保持啟用。 OpenAI 的 ChatGPT 廣告像素亦會在您同意廣告追蹤後衡量頁面瀏覽及已提交的查詢,並可能使用經雜湊處理的聯絡資料作配對。 私隱政策
Riemann Sums & 3D Integrals turns multivariable integration into a tactile 3D geometry model. Students see a translucent curved surface z = f(x, y) hovering over a subdivided xy-domain filled with height-colored rectangular columns. Each column has base area Δx·Δy and height f(xᵢ*, yⱼ*) sampled according to the selected rule. Dragging the glowing probe across the surface highlights the active prism and displays its individual volume dV = f(x, y) Δx Δy, while dragging the corner boundary handle resizes the integration domain. By sliding the grid resolution N from coarse blocks up to a 20×20 mesh of 400 columns across Paraboloid Dome, Saddle Wave, and Gaussian Hill surfaces, learners observe how the double sum converges to the exact analytical double integral.
A 3D Riemann sum divides a two-dimensional region R in the xy-plane into small rectangles of area ΔA = Δx·Δy. Above each rectangle, a vertical prism is built up to the surface height f(xᵢ*, yⱼ*). Adding the volumes of all N² prisms approximates the exact double integral.
In the Midpoint rule, the prism height is evaluated at the center of each sub-rectangle. For a sloped surface, the part of the surface rising above the flat prism top on one side nearly cancels the part dipping below it on the opposite side, reducing error to O(1/N²).
As N increases, the base dimensions Δx and Δy become smaller while the number of columns grows as N². The stepped tops of the prisms fit the smooth surface ever more tightly, and in the limit N → ∞ the Riemann sum equals the exact double integral.
Click any rectangular column or drag the glowing red probe sphere over the surface. The selected column is framed in gold and its floating label displays the exact differential volume dV = f(xᵢ*, yⱼ*) Δx Δy.
免費嵌入你的學習平台、網誌或班級網頁。
<iframe src="https://kiwibee.io/zh/simulations/riemann-sums-double-integral-3d-3d-simulation/embed" title="Riemann Sums & 3D Integrals | KiwiBee" loading="lazy" allowfullscreen style="width:100%;height:min(70vh,620px);min-height:420px;border:0;border-radius:16px"></iframe>繼續探索
Approximate the area under a curve with strips and choose how each takes its height: left edge, right edge, middle, or a sloping top. Push the strip count up and watch the error fall, with the running total plotted as its own curve.

Type any function and see its shape straight away. Plot up to three at once in three colours to compare them, drag the trace point to read a value off a curve, and see where each one crosses zero.

Spin a spinner, flip a coin or roll a die and watch two sets of bars: the chances the shapes predict, and the results you actually got. Ten spins prove nothing; a few hundred and the two are hard to tell apart.

Move m and watch the line tilt; move b and watch it slide. Or drag the two points on the line and read the equation it writes back. A rise-over-run staircase climbs the line so slope becomes something you can count.
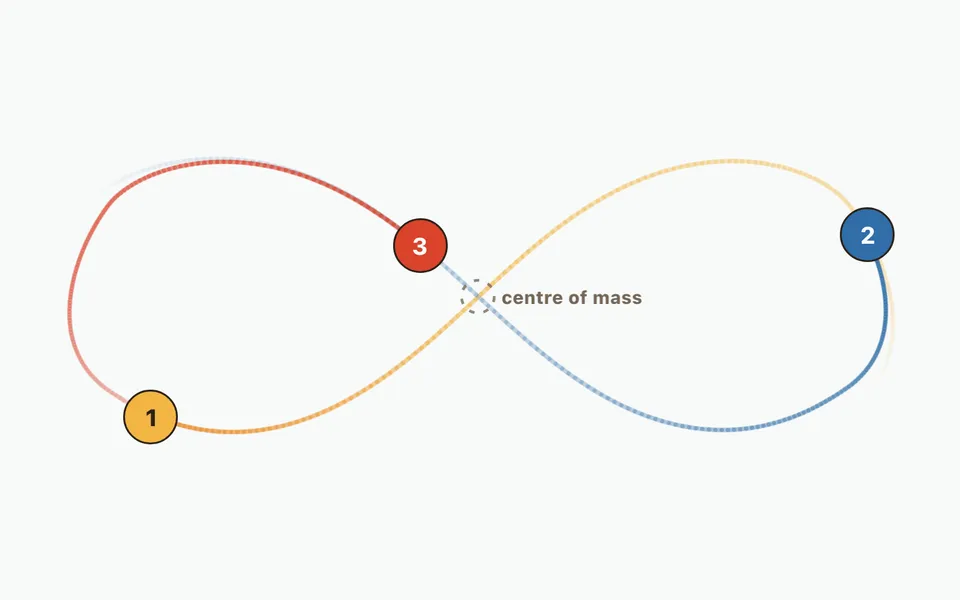
Compare a two-body orbit with three-body figure-eight motion, then add up to twelve bodies. Change initial masses, velocities and positions; watch orbit trails and numerical energy error.
由模型到紀錄
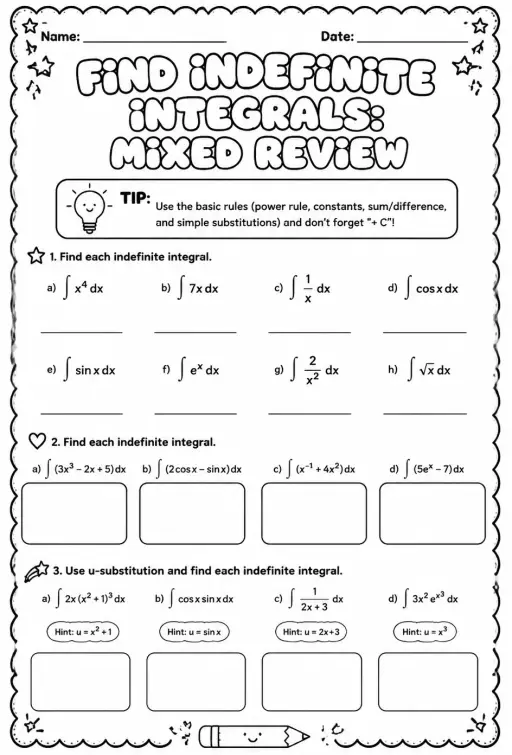
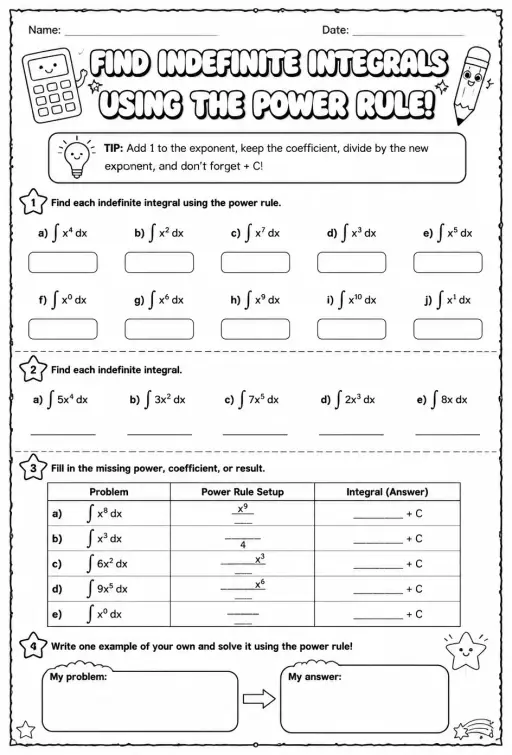
學生探索之後,用工作紙記錄他們的預測、觀察和解釋。
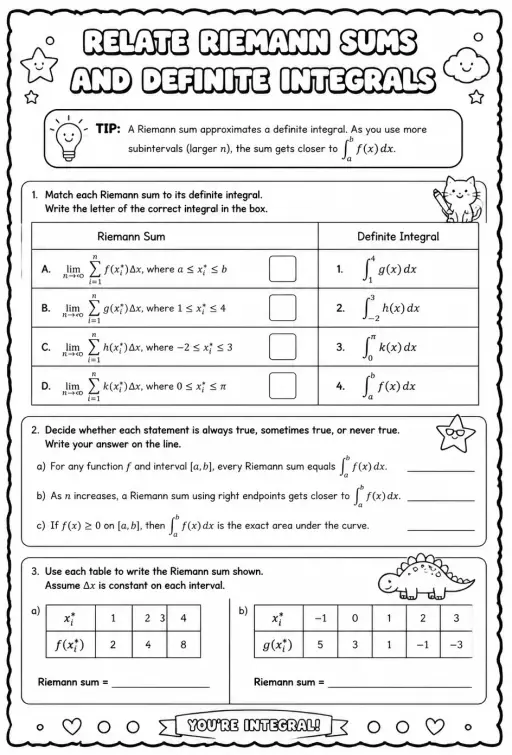
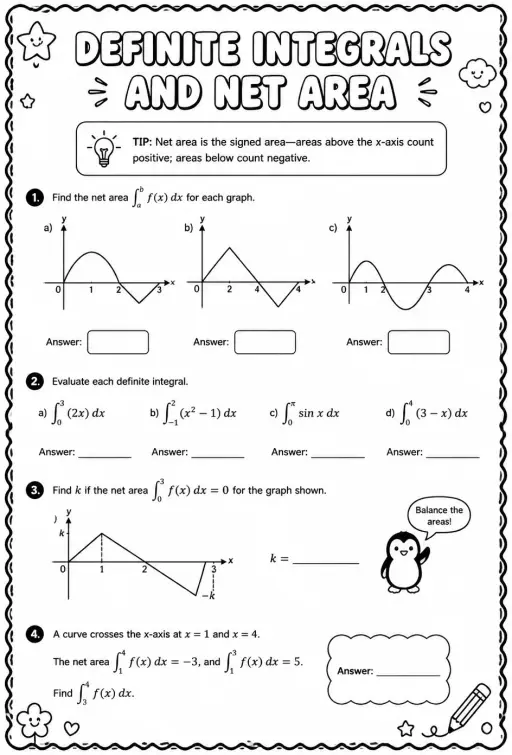
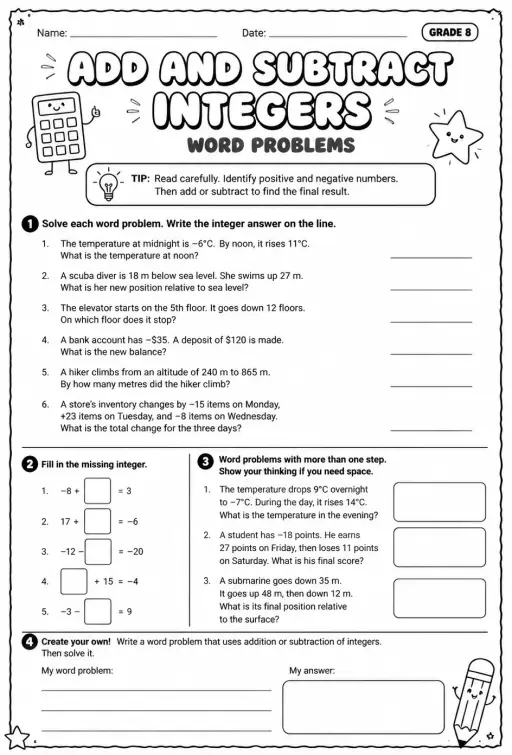
KiwiBee 的免費教師工作空間,把備課、工作紙、課堂工具和成績冊集中在同一處。
免費開始,建立你的第一個班別 首頁
 所有解決方案
 價格
 關於我們
 KiwiBee 非牟利機構計劃
 活動及網上研討會
 適合大型教育機構
 適合學校
 適合教育中心
 適合團隊主管
 適合教師
 AI 和教學資源
 教學資源
 可列印工作紙
 課程包
 互動模擬
 教師工具
 AI 工作室
 教學構思與研究