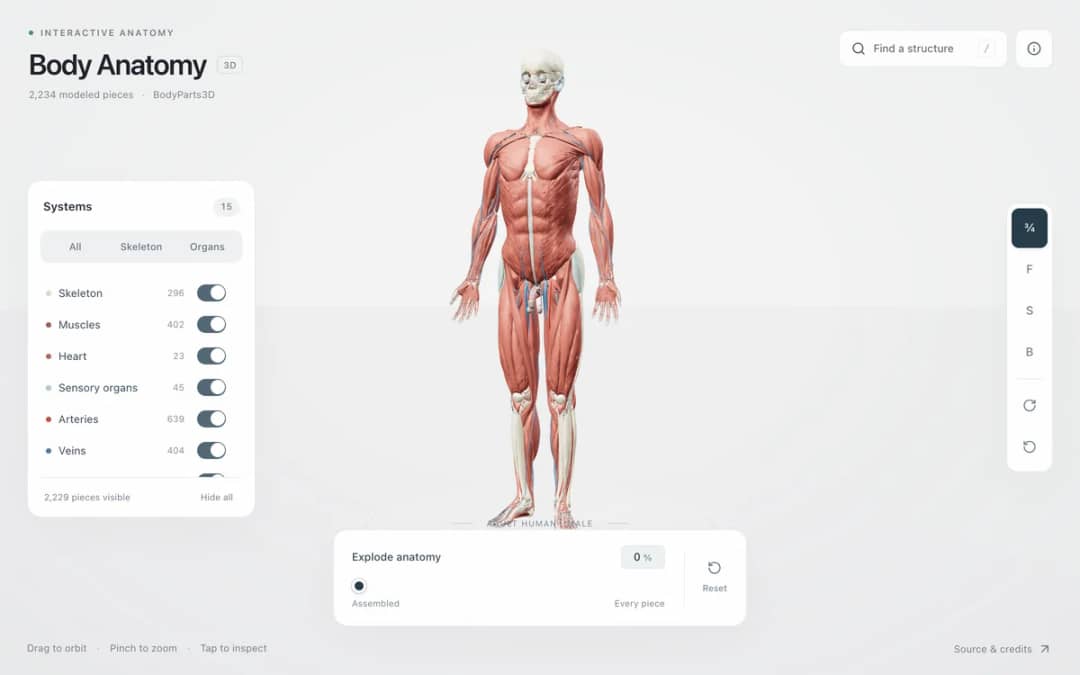
Explore an adult male reference body in 3D. Reveal 14 anatomical systems, search thousands of named structures, isolate organs, and pull 2,209 modeled pieces apart to see how the body is organized.
—
KiwiBee uses optional Google Analytics, Google Ads, and Meta Pixel cookies to understand adult visitors, measure completed sign-ups, and improve campaigns. Essential cookies always stay on. OpenAI’s ChatGPT Ads Pixel also measures page views and completed enquiries after advertising consent, and may use hashed contact details for matching. Privacy policy
H–R Diagram & Star Cluster brings the Hertzsprung–Russell diagram to life in 3D. The horizontal axis plots surface temperature backwards from hot blue O-type stars (40,000 K) on the left to cool red M-type stars (2,500 K) on the right, while the vertical axis plots logarithmic luminosity log(L/L_sun). Students can drag a glowing test star anywhere across the H–R plane or adjust its mass slider to compute its exact radius in solar radii via the Stefan–Boltzmann law. Evolving the Cluster Age slider from 0.01 to 12 Gyr demonstrates why high-mass stars burn through their fuel rapidly and peel off the Main Sequence turnoff point into Red Giants, Supergiants, and White Dwarfs.
Historically, astronomers plotted stars by spectral class from O to M (or color index B-V from blue to red) moving left to right. Because O-stars are the hottest and M-stars are the coolest, temperature increases toward the left.
By the Stefan–Boltzmann law (L = 4πR²σT⁴), a cool red star emits less light per square meter of surface, so the only way it can shine with high total luminosity is to have an enormous surface area—making it a Red Giant or Supergiant.
Although a star with 10 times the Sun's mass has 10 times more hydrogen fuel, its luminosity is roughly 3,000 times brighter (L ∝ M^3.5). It burns through its core fuel in just a few tens of millions of years, whereas low-mass red dwarfs last trillions of years.
The Sun is a spectral class G2V Main Sequence star near the middle of the diagram, with a surface temperature of 5,778 K, a luminosity of 1.0 L_sun, and a radius of 1.0 R_sun.
Drop it into your LMS, blog, or class site — free.
<iframe src="https://kiwibee.io/en/simulations/hr-diagram-3d-star-cluster-3d-simulation/embed" title="H–R Diagram & Star Cluster | KiwiBee" loading="lazy" allowfullscreen style="width:100%;height:min(70vh,620px);min-height:420px;border:0;border-radius:16px"></iframe>Continue exploring
Explore an adult male reference body in 3D. Reveal 14 anatomical systems, search thousands of named structures, isolate organs, and pull 2,209 modeled pieces apart to see how the body is organized.
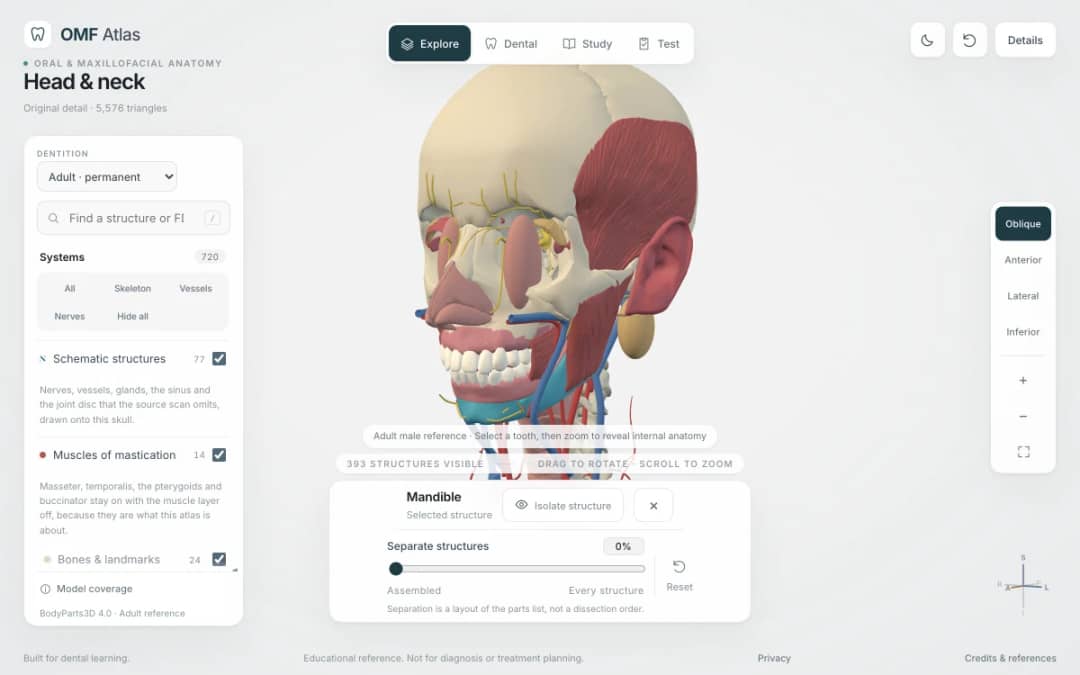
Explore the head and neck in 3D: 643 source meshes across 14 layers, 47 facial and masticatory muscles, and 77 drawn nerves, vessels and glands the source scan omits. Open any tooth onto its own pulp canal, and follow the seven stages of tooth development.

Free interactive photosynthesis simulation. Explore photosynthesis hands-on online — great for whole-class or independent practice.

Free interactive states of matter simulation. Explore states of matter hands-on online — great for whole-class or independent practice.

Free interactive shadows simulation. Explore shadows hands-on online — great for whole-class or independent practice.
From model to evidence
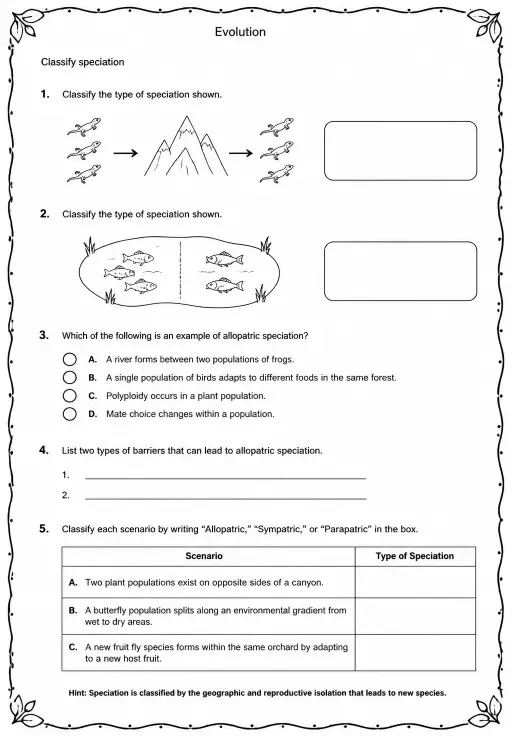
Use a worksheet to capture predictions, observations, and explanations after students explore.
KiwiBee's free teacher workspace brings lesson planning, worksheets, classroom tools, and gradebook together in one place.
Start free and create your first class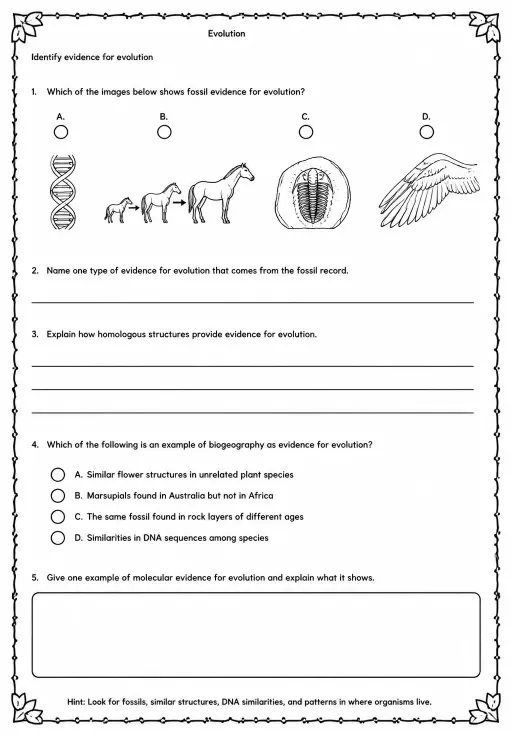
 Home
 All solutions
 Pricing
 About us
 KiwiBee for Non-profits
 Events & webinars
 For big organisations
 For schools
 For centers
 For team leaders
 For teachers
 AI and resources
 Resources
 Printable worksheets
 Lesson Packs
 Interactive simulations
 Teacher tools
 AI studio
 Ideas and research