
Dice Probability
- Math
Comments
Related to this simulation
Picked by meaning from games, worksheets, simulations, teacher tools and videos.
About this simulation
Dice Probability rolls two fair dice and tallies the sums from 2 to 12 as bars. Students click the dice or the table for one roll, or press Roll 100 to build a histogram quickly. An orange theory overlay marks the expected shares, and readouts show the last roll, the number of rolls, the most common sum, the mean and the chance of a 7. Percent labels can be switched on. Early results look lumpy, but with more rolls the bars settle toward the triangle, which makes the law of large numbers and sample space reasoning easy to discuss.
What students can explore
- Click the dice ten times and note how uneven the histogram looks.
- Press Roll 100 several times and watch the bars move toward the orange theory markers.
- Turn on Show percent and compare the observed share of 7 with the P(sum = 7) readout.
- Press Clear counts and check whether a new set of rolls gives the same most common sum.
- Hide the Theory overlay, predict which sums are least likely, then reveal it.
Learning objectives
- 1List the 36 equally likely outcomes of rolling two dice.
- 2Explain why a sum of 7 is more likely than 2 or 12.
- 3Compare experimental results with theoretical probabilities.
- 4Describe how more trials make relative frequencies approach the theory.
Questions teachers ask
Is it free?
Yes, completely free with no login. Any modern browser will run it, so it works on school tablets, whiteboards and personal phones.
Why is 7 the most common sum?
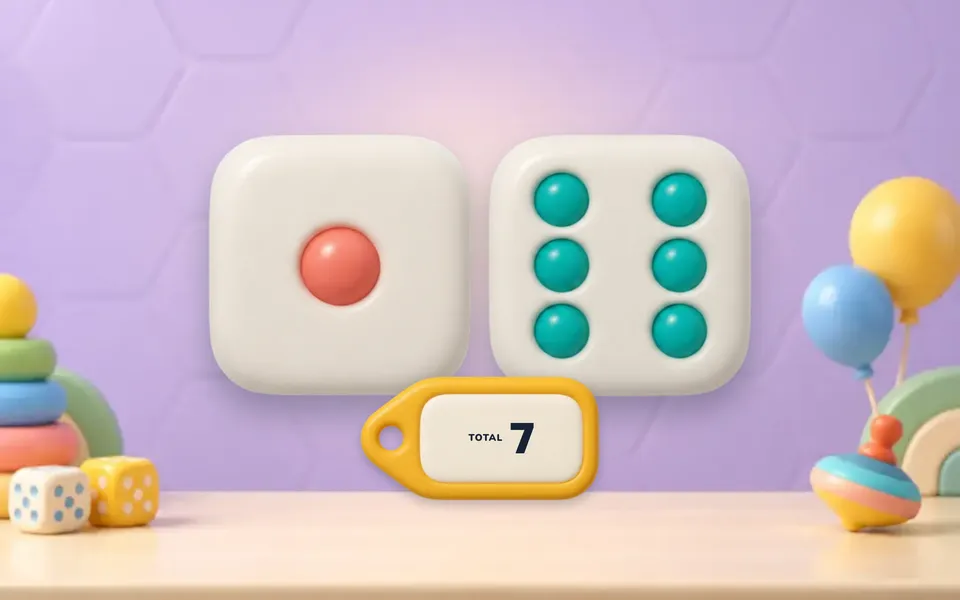
Six of the 36 equally likely outcomes give 7, while only one gives 2 and one gives 12. So the chance of 7 is 6/36, or 1/6.
Why are my results different from the theory?
Small samples vary a lot by chance. As the number of rolls grows, the observed shares usually move closer to the theoretical ones, which is the law of large numbers.
How do I use it for a lesson?
Have students predict the shape, roll a few times, then use Roll 100 repeatedly and compare with the theory overlay. Clear counts to repeat the experiment.
Embed this simulation
Drop it into your LMS, blog, or class site — free.
<iframe src="https://kiwibee.io/en/simulations/dice-probability-3d-simulation/embed" title="Dice Probability | KiwiBee" loading="lazy" allowfullscreen style="width:100%;height:min(70vh,620px);min-height:420px;border:0;border-radius:16px"></iframe>Curriculum standards
Cambridge
- 8Sp.04Design and conduct chance experiments or simulations, using small and large numbers of trials. Compare the experimental probabilities with theoretical outcomes.Cambridge Lower Secondary Mathematics (0862) — Stage 8 › Statistics and Probability › Probability
- 8Sp.03Understand how to find the theoretical probabilities of equally likely combined events.Cambridge Lower Secondary Mathematics (0862) — Stage 8 › Statistics and Probability › Probability
Learning objectives © UCLES (Cambridge University Press & Assessment), quoted with attribution.
Bring interactive science into your classroom
KiwiBee's free teacher workspace brings lesson planning, worksheets, classroom tools, and gradebook together in one place.
Start free and create your first classWatch KiwiBee on YouTube
Short KiwiBee videos for teachers and schools. Subscribe, or follow KiwiBee wherever you are.
 Home
 All solutions
 Pricing
 About us
 KiwiBee for Non-profits
 Events & webinars
 For big organisations
 For schools
 For centers
 For team leaders
 For teachers
 Resources
 Printable worksheets
 Interactive simulations
 Teacher tools
 Ideas and research


