
PPTX · 10 slides
Bar Graphs: Reading and Choosing the Right Graph
MathGrade 1English
Slide 1 of 10
More like this presentation
Picked by meaning from games, worksheets, simulations, teacher tools and videos.
 WorksheetInterpret bar graphs
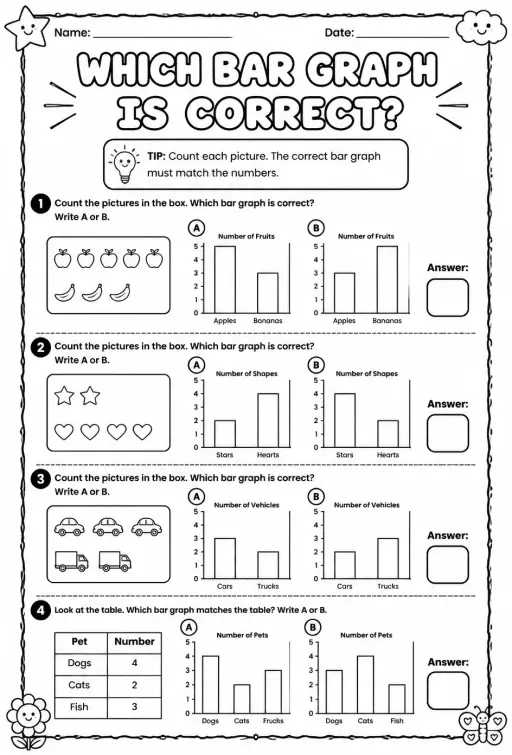 WorksheetWhich bar graph is correct?
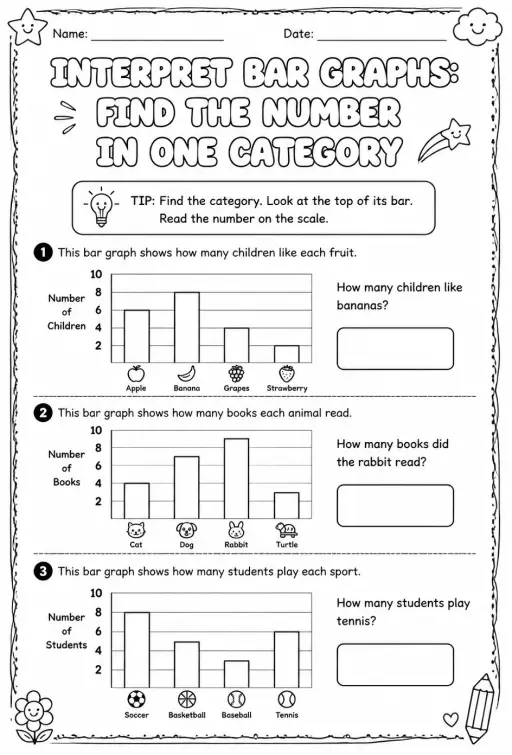 WorksheetInterpret bar graphs: find the number in one category
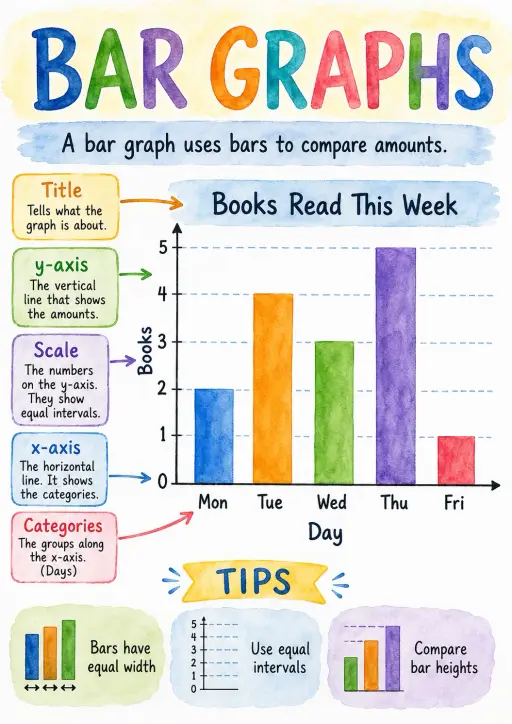 WorksheetBar graphs Data and Statistics Infographic
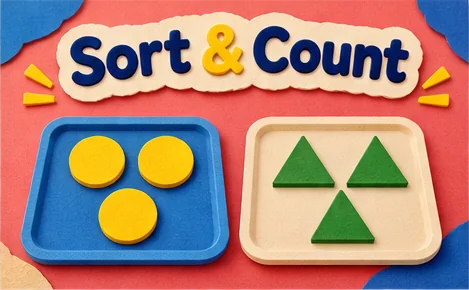 GameSort, Count and Tell the Class
 GameGraphs, Mean and Median
 GameData Detectives at School
 GameA Survey Becomes a Digital Chart
About this presentation
Help Grade 1 pupils read bar graphs with bright, picture-led slides. Children follow the top of a bar across to the scale, find how many pets a bar shows, compare the tallest and shortest bars and choose the graph that matches a story. The 20-slide presentation starts with a warm-up on favourite pets and ends with a 7-question quiz.
Likes & comments
See what other teachers think and share a helpful note.
Loading likes and comments…
Worksheet Studio
Make a worksheetFollow the slides with a matching worksheet
Make a printable on the same topic for any age and language. Free.
 Home
 All solutions
 Pricing
 About us
 KiwiBee for Non-profits
 Events & webinars
 For big organisations
 For schools
 For centers
 For team leaders
 For teachers
 Resources
 Printable worksheets
 Interactive simulations
 Teacher tools
 Ideas and research


