
——
Graphs, Mean and Median
- Mathematics
- Grade 6
- English
More like this game
Picked by meaning from games, worksheets, simulations, teacher tools and videos.
 GameSports Data Beyond the Average
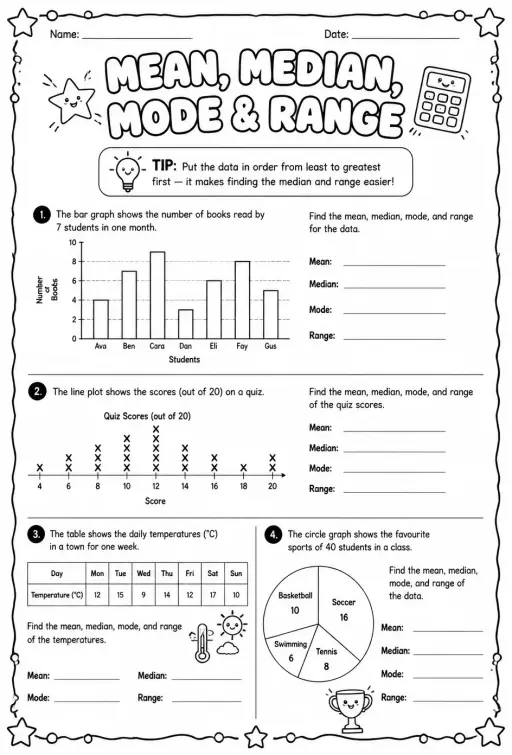 WorksheetInterpret charts and graphs to find mean, median, mode, and range
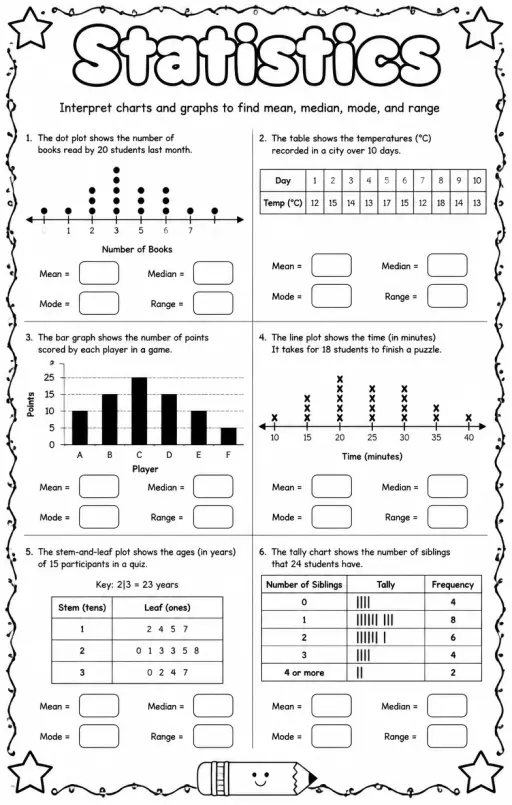 WorksheetInterpret charts and graphs to find mean, median, mode, and range
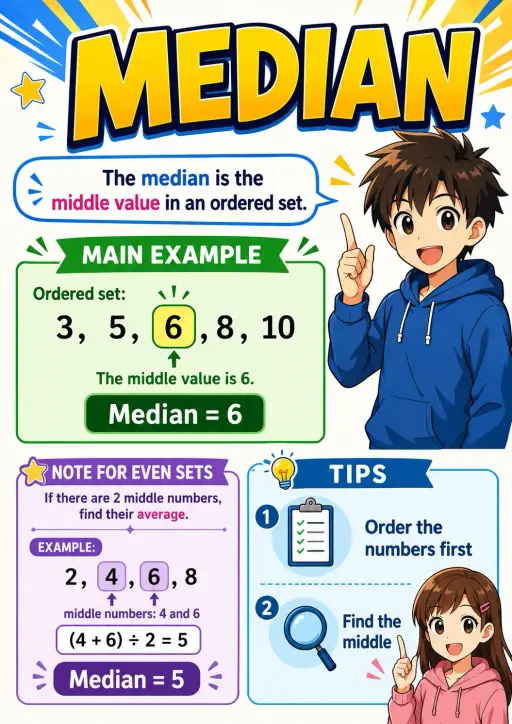 WorksheetMedian Data and Statistics Infographic
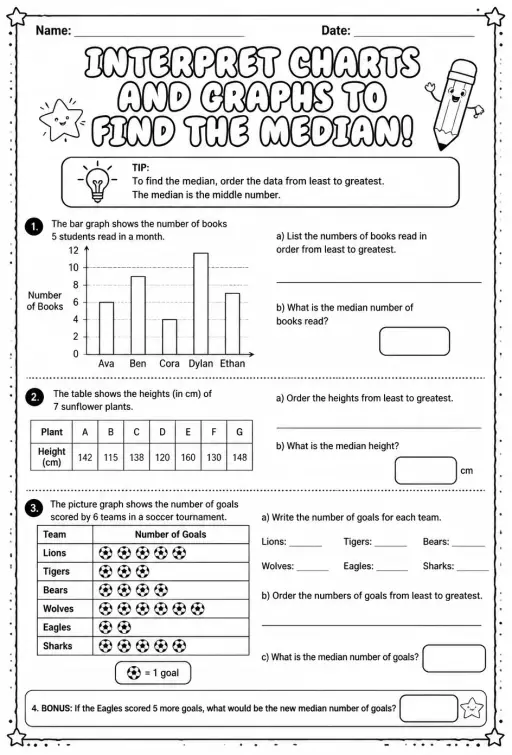 WorksheetInterpret charts and graphs to find the median
 GamePercentages in Everyday Life
 GameData Detectives at School
 GameA Survey Becomes a Digital Chart
Curriculum standards
Cambridge
- 6Ss.03Understand that the mode, median, mean and range are ways to describe and summarise data sets. Find and interpret the mode (including bimodal data), median, mean and range, and consider their appropriateness for the contextCambridge Primary Mathematics (0096) — Stage 6 › Statistics and Probability › Statistics
Learning objectives © UCLES (Cambridge University Press & Assessment), quoted with attribution.
Read simple charts and calculate mean and median from supplied data. Compare totals, order values, and notice how an unusually large number affects an average.
Learning objective
Interpret supplied bar charts and calculate arithmetic mean and median for small data sets.
How to play
Inspect each picture and read the prompt. Choose, type, put items in order or set the slider as requested. Read the explanations to learn from each answer.
- Subject
- Mathematics
- Grade
- Grade 6
- Content language
- English
Topic tags
Compatible game modes
Play it as a game
Press Play, then pick a game under “Switch game”.
Solo games
- Build a Robot
- Colour the Picture
- Tower Stack
- Treasure Dive
- Goal Kick
- Balloon Pop
Team games
- Plinko
- Tug of War
- Team Penalties
- Bowling
- Mystery Boxes
- Team Race
- Tic Tac Toe
- Four in a Row
- Prize Wheel
- Ship Hunt
Watch KiwiBee on YouTube
Short KiwiBee videos for teachers and schools. Subscribe, or follow KiwiBee wherever you are.
 Home
 All solutions
 Pricing
 About us
 KiwiBee for Non-profits
 Events & webinars
 For big organisations
 For schools
 For centers
 For team leaders
 For teachers
 Resources
 Printable worksheets
 Interactive simulations
 Teacher tools
 Ideas and research


