KiwiBee printable
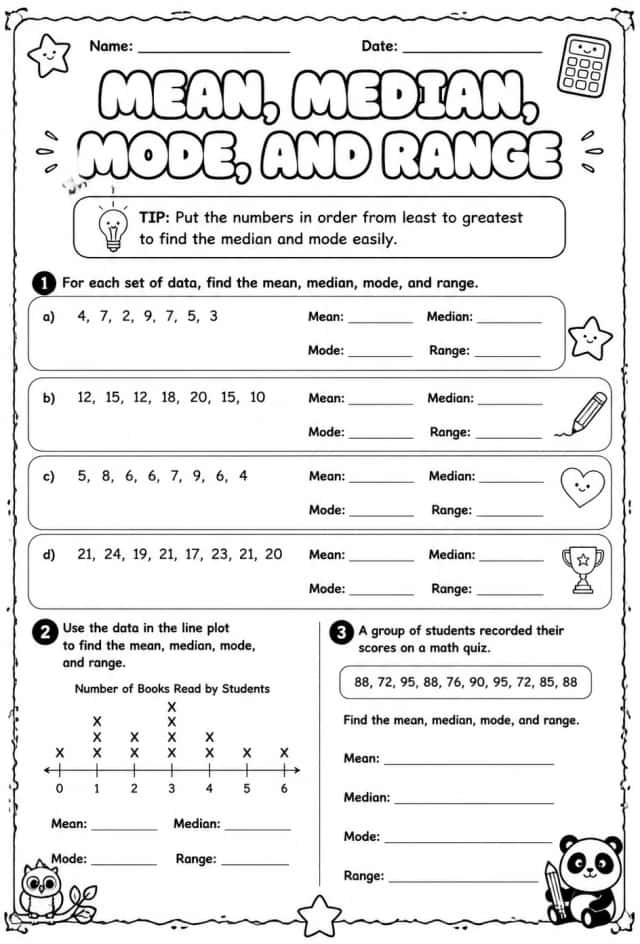
Interpret charts and graphs to find mean, median, mode, and range
Free printable Grade 7 math worksheet for "Interpret charts and graphs to find mean, median, mode, and range" — practice statistics. No-prep, print or assign online.
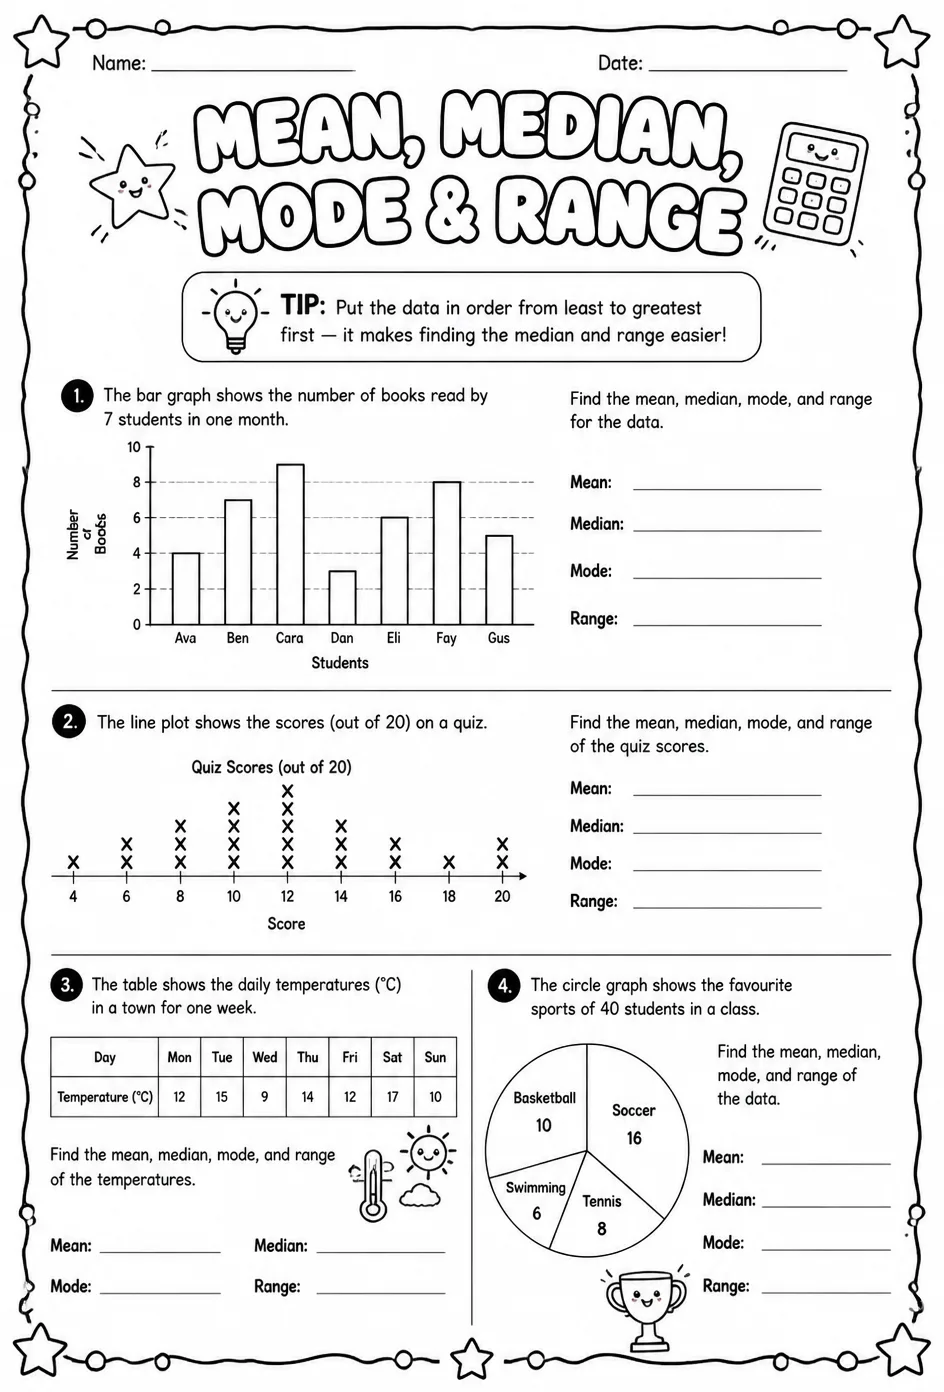
This worksheet challenges middle school students to interpret different types of charts and graphs, reinforcing their understanding of mean, median, mode, and range. Teachers can use it to assess students' ability to extract and analyze statistical information from visual data representations. Ideal for strengthening data analysis skills in a statistics unit, it supports critical thinking and real-world application of math concepts.
Learning objectives
- Analyze various charts and graphs to calculate the mean, median, mode, and range of data sets.
- Interpret statistical data presented visually to draw accurate conclusions about data distribution.
- Apply problem-solving strategies to identify and explain measures of central tendency and variability.
How to use this worksheet
- Click “Download Worksheet” and sign in with Google or email to get the PDF instantly.
- Print at home or in class for Middle School; it's no-prep, with no extra materials needed.
- Hand it out as classwork, homework, or a quick warm-up.
Likes & comments
See what other teachers think and share a helpful note.
Loading likes and comments…
Create more worksheets in our Worksheet Studio
Generate fresh worksheets for any grade, topic, and language — free.
Open the Worksheet StudioRelated worksheets
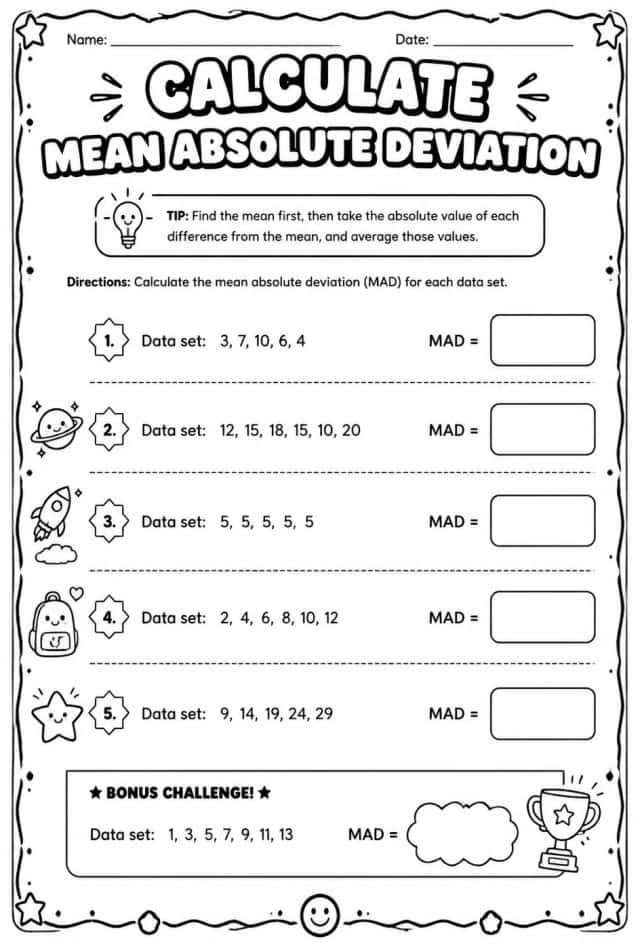
Calculate mean absolute deviation
Worksheets
hard
Ages 11–14
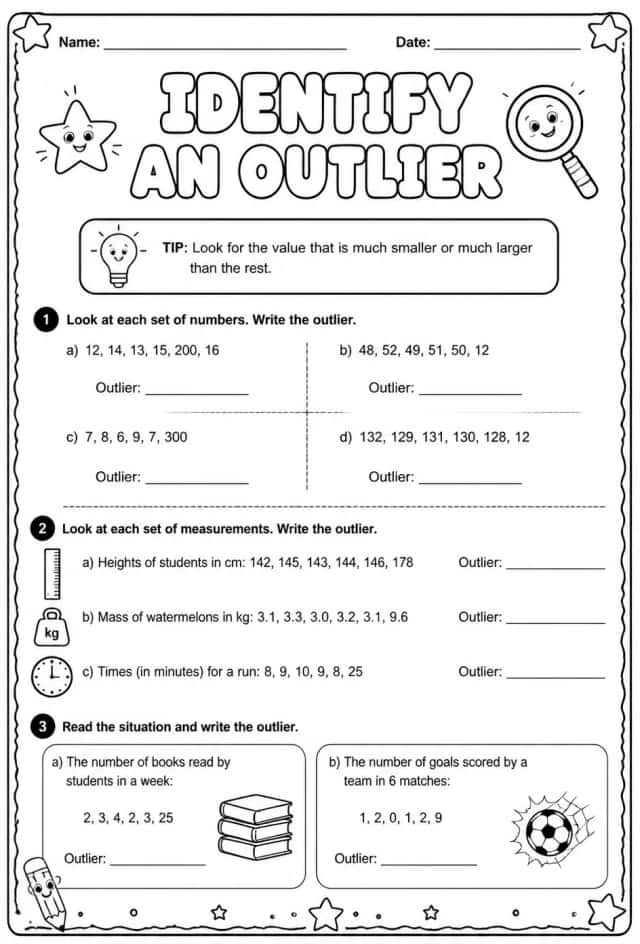
Identify an outlier
Worksheets
hard
Ages 11–14
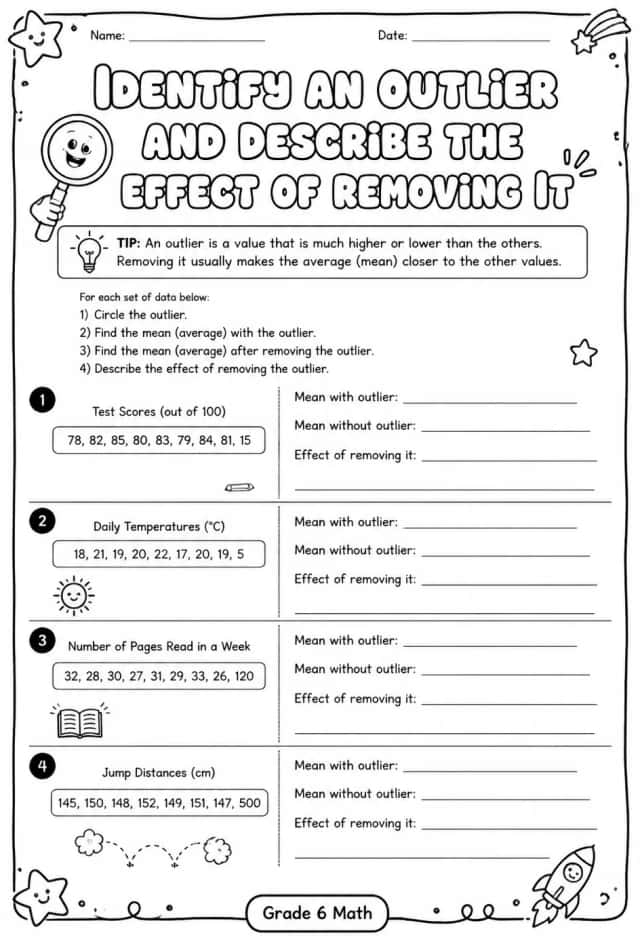
Identify an outlier and describe the effect of removing it
Worksheets
hard
Ages 11–14
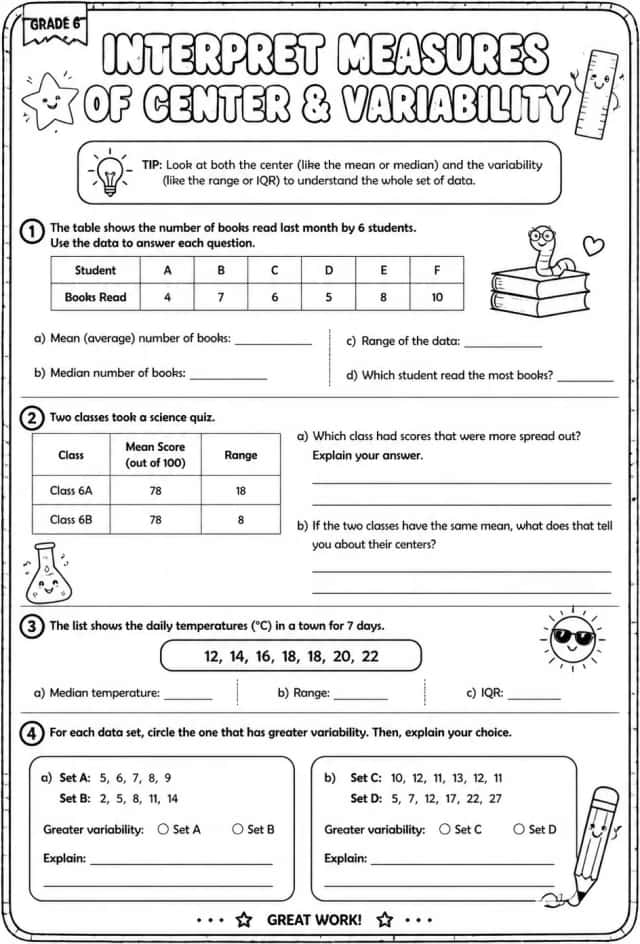
Interpret measures of center and variability
Worksheets
hard
Ages 11–14
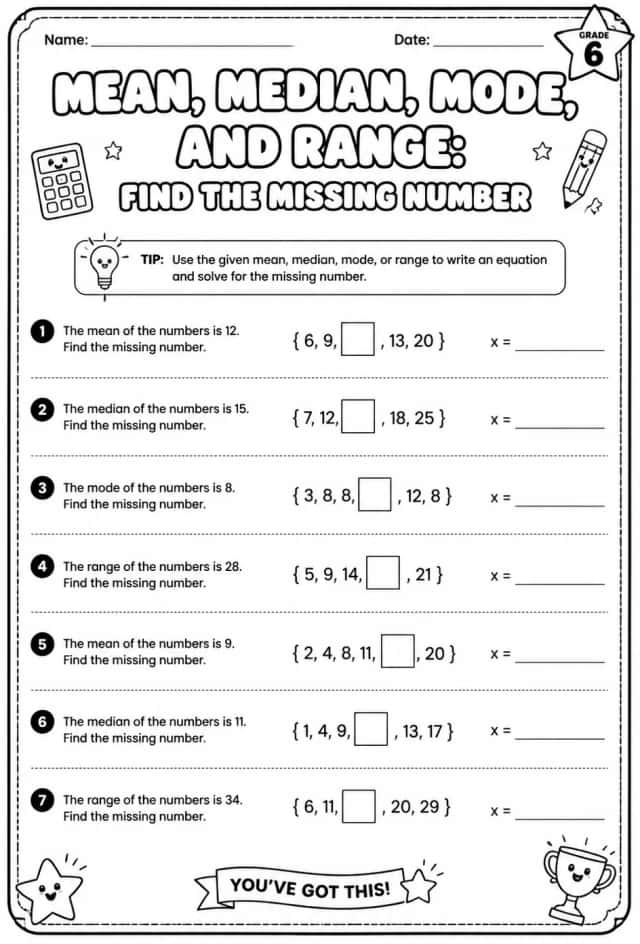
Mean, median, mode, and range: find the missing number
Worksheets
hard
Ages 11–14
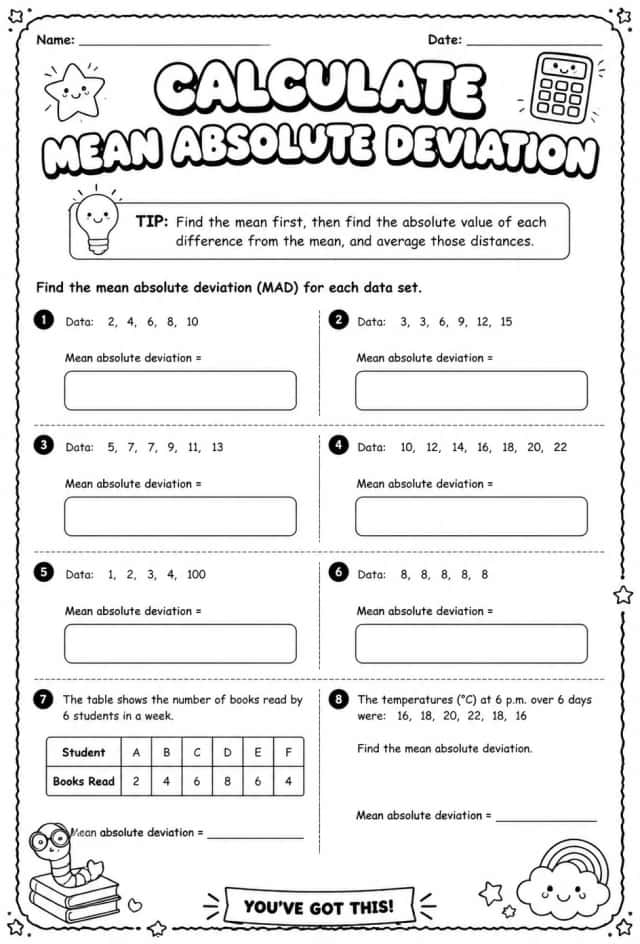
Calculate mean absolute deviation
Worksheets
hard
Ages 11–14
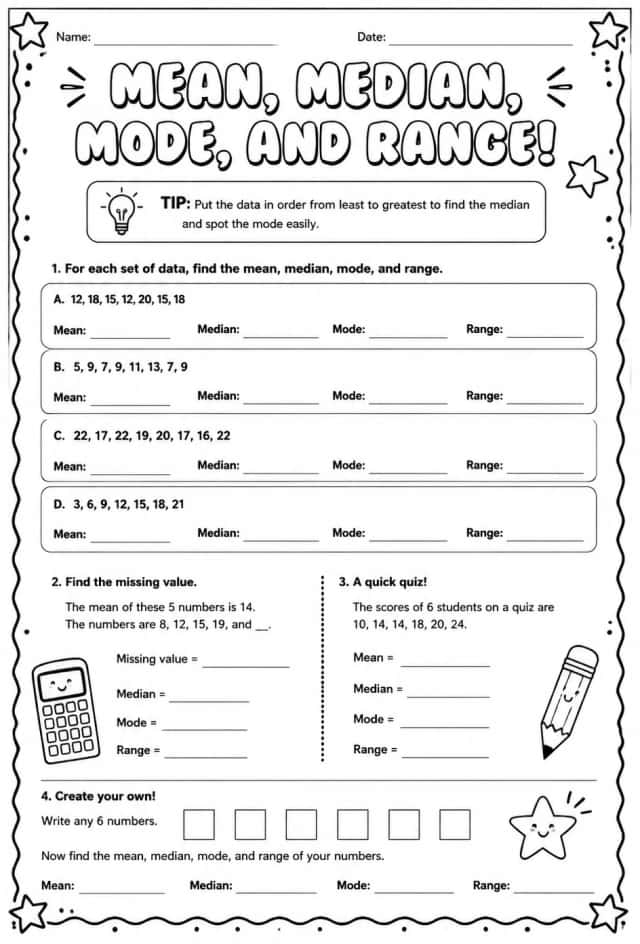
Calculate mean, median, mode, and range
Worksheets
hard
Ages 11–14
Calculate mean, median, mode, and range
Worksheets
hard
Ages 11–14