KiwiBee printable
Interpret bar graphs
Free printable Grade 1 math worksheet for "Interpret bar graphs" — practice data and graphs. No-prep, print or assign online.
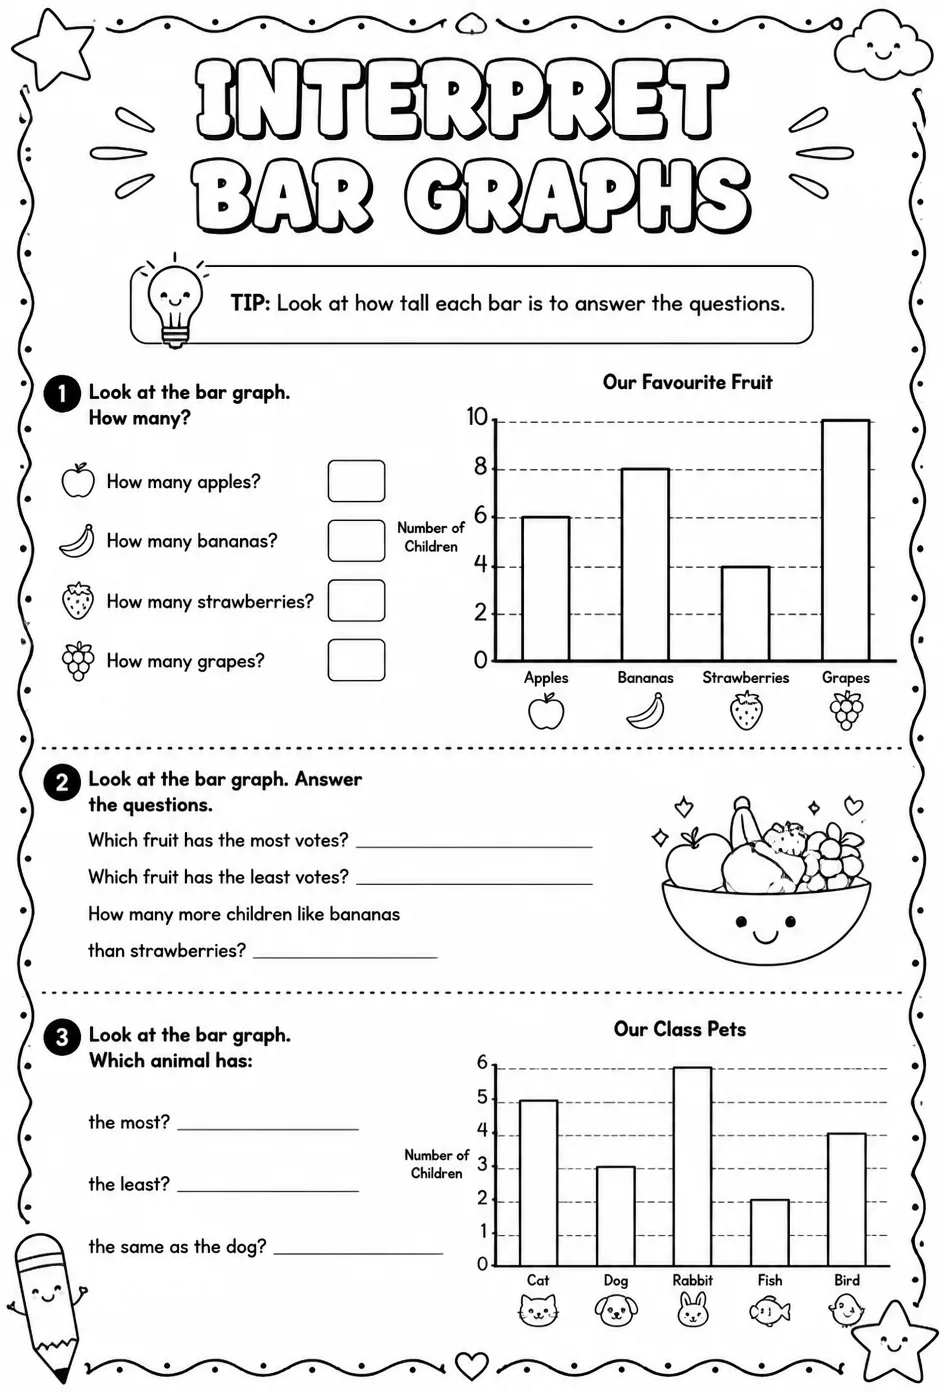
This worksheet helps Grade 1 students practice interpreting bar graphs by analyzing simple data sets. Teachers can use it to reinforce concepts in data and graphs, encouraging students to read and understand visual information. It supports developing early data literacy skills through engaging, hands-on activities.
Learning objectives
- Identify and describe information presented in bar graphs
- Compare quantities using bar graph data
- Answer questions based on the interpretation of bar graphs
How to use this worksheet
- Select “Sign in to download free”, then sign in with Google or email to get the PDF from KiwiBee Printables.
- Print at home or in class for Grade 1; it's no-prep, with no extra materials needed.
- Hand it out as classwork, homework, or a quick warm-up.
Likes & comments
See what other teachers think and share a helpful note.
Loading likes and comments…
Create more worksheets in our Worksheet Studio
Generate fresh worksheets for any grade, topic, and language — free.
Open the Worksheet StudioRelated worksheets
Pack
Grade 1 Data And Graphs Math Worksheet Pack
Pack
math
medium
Ages 6–8
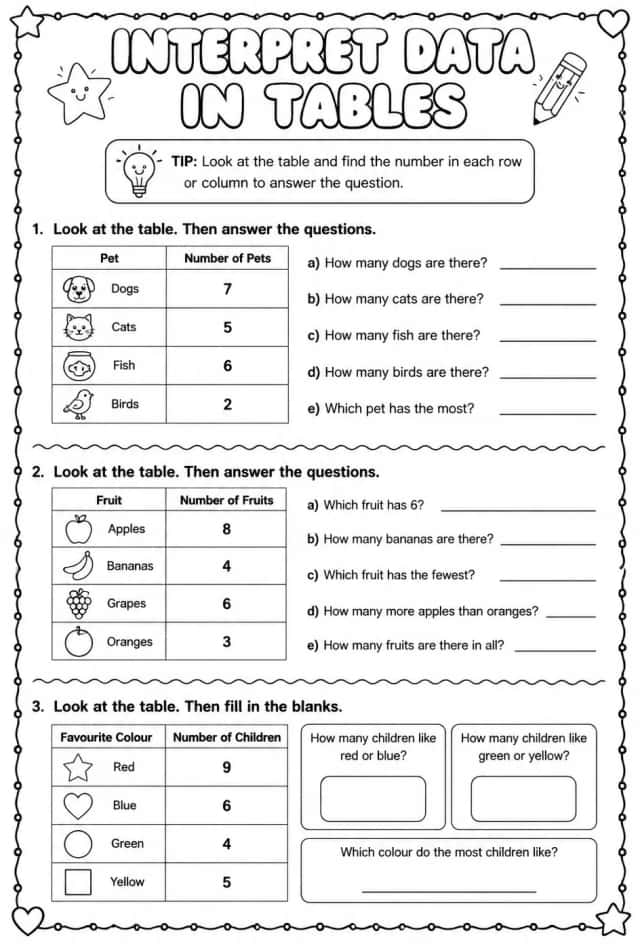
Interpret data in tables
Worksheets
medium
Ages 6–7
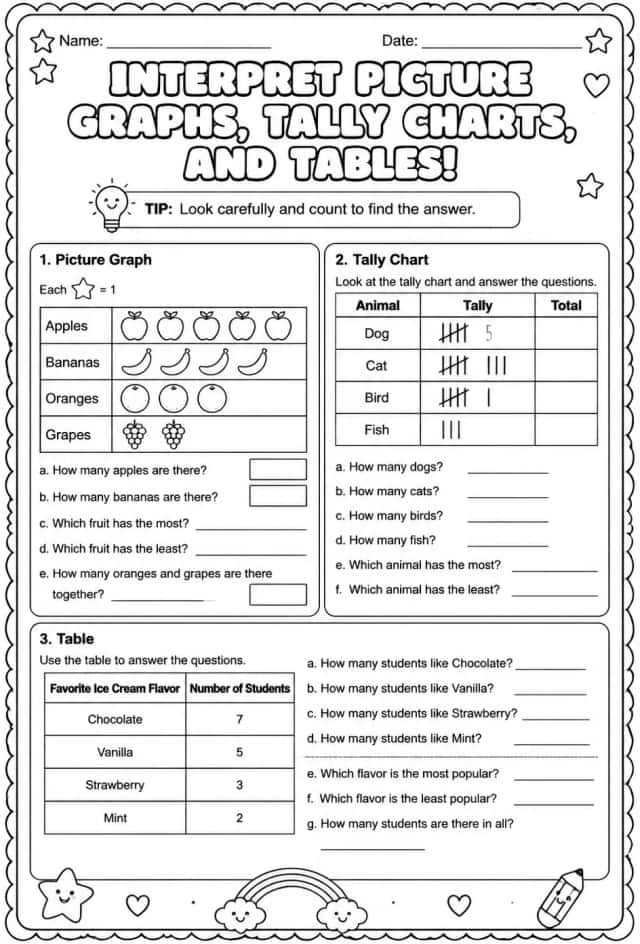
Interpret picture graphs, tally charts, and tables
Worksheets
medium
Ages 6–7
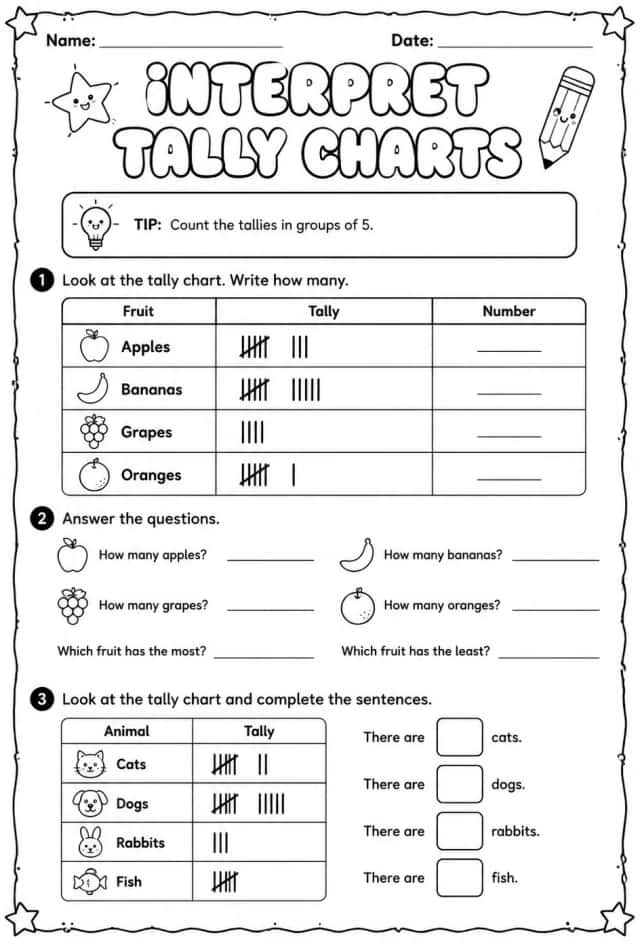
Interpret tally charts
Worksheets
medium
Ages 6–7
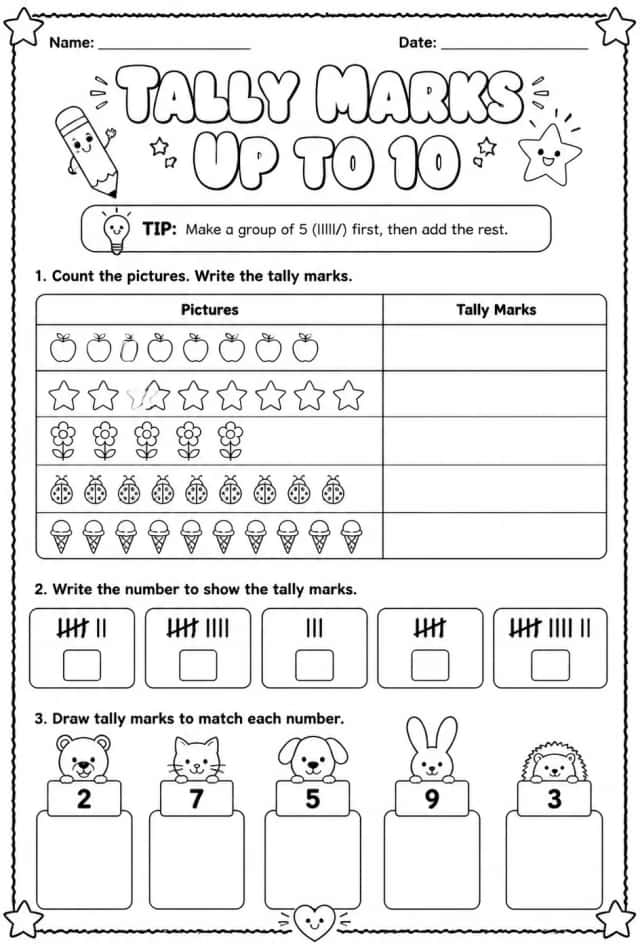
Tally marks - up to 10
Worksheets
medium
Ages 6–7
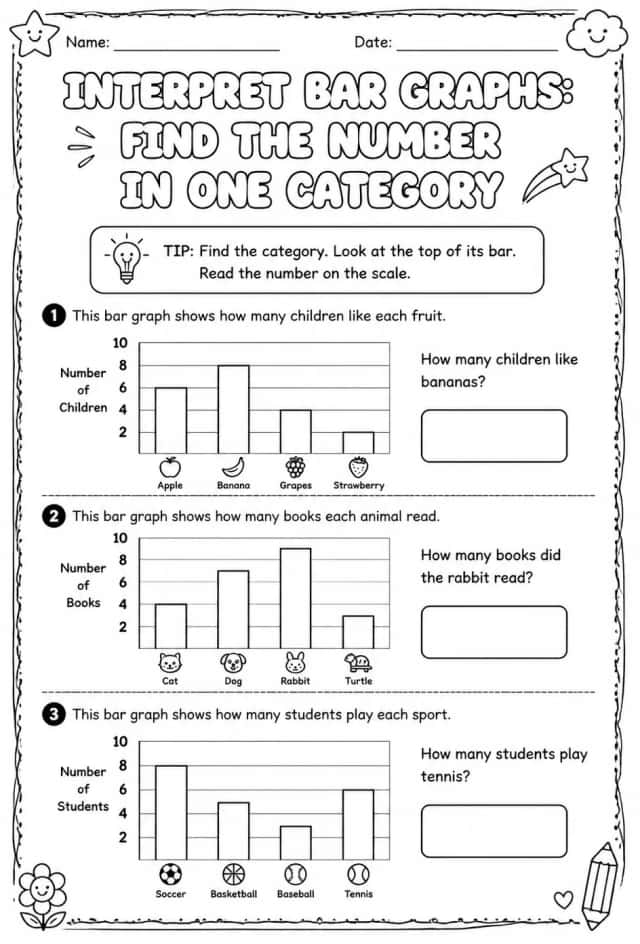
Interpret bar graphs: find the number in one category
Worksheets
medium
Ages 6–7
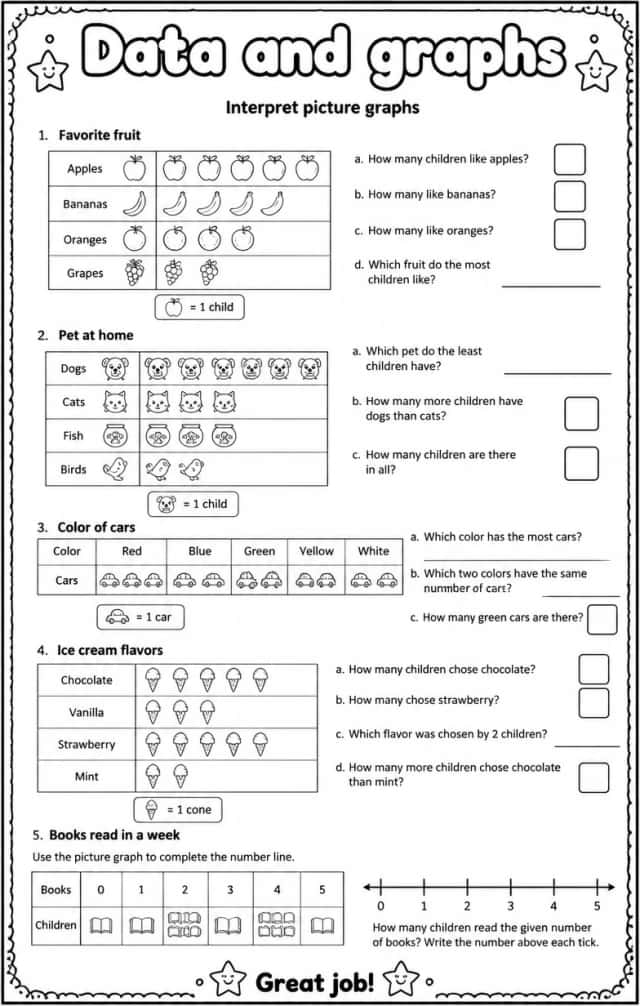
Interpret picture graphs
Worksheets
medium
Ages 6–7
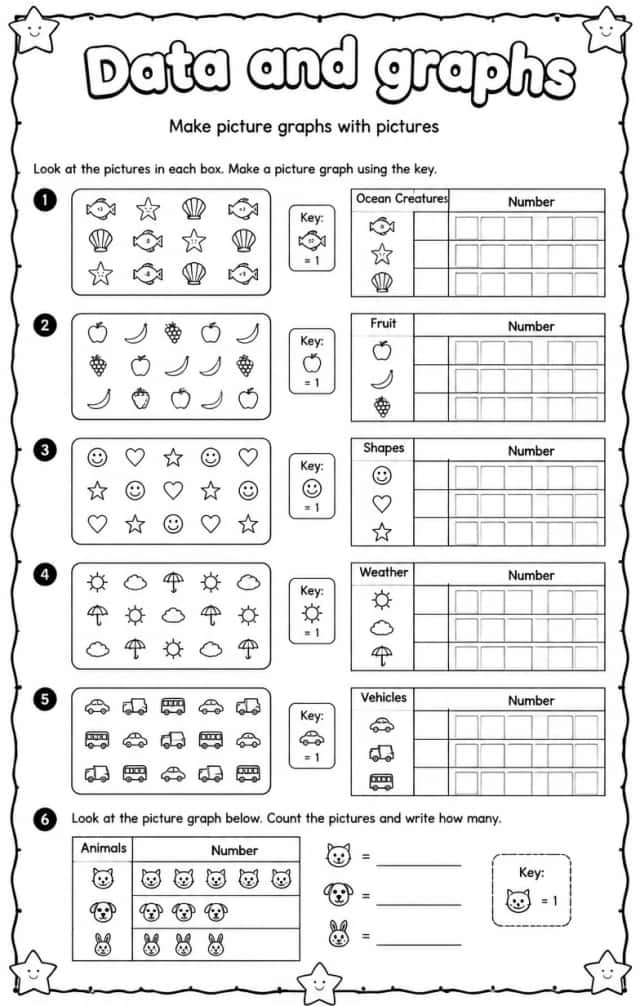
Make picture graphs with pictures
Worksheets
medium
Ages 6–7