
Accumulation from a Rate Graph
- Mathematics
- Grade 11
- English
More like this game
Picked by meaning from games, worksheets, simulations, teacher tools and videos.

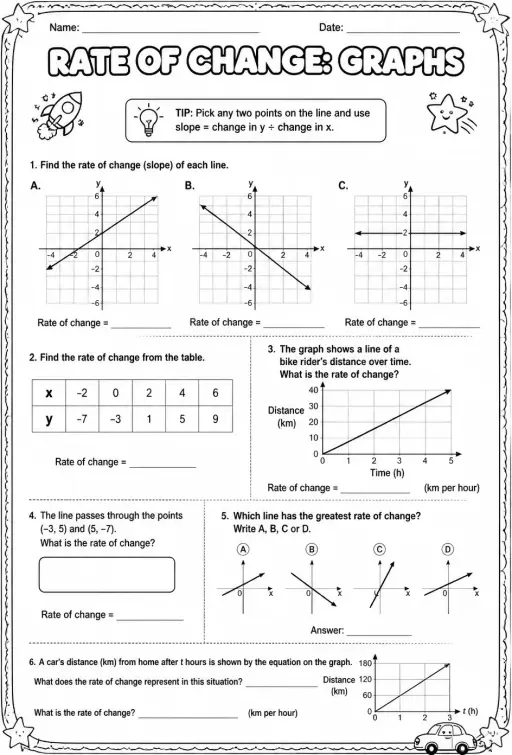
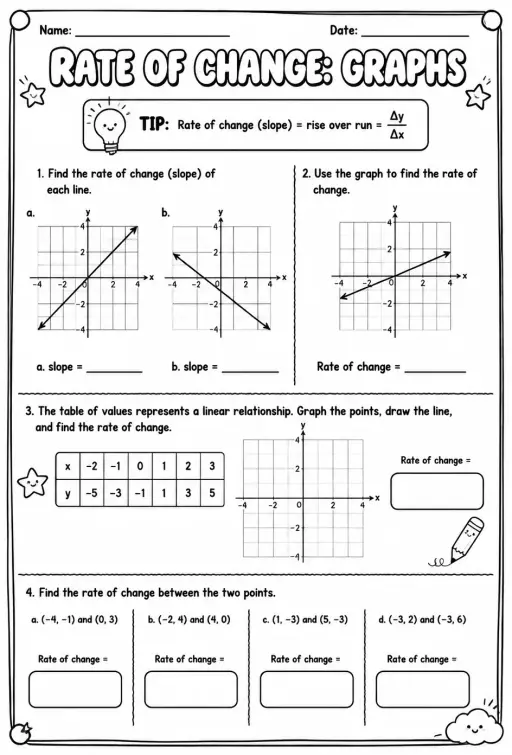
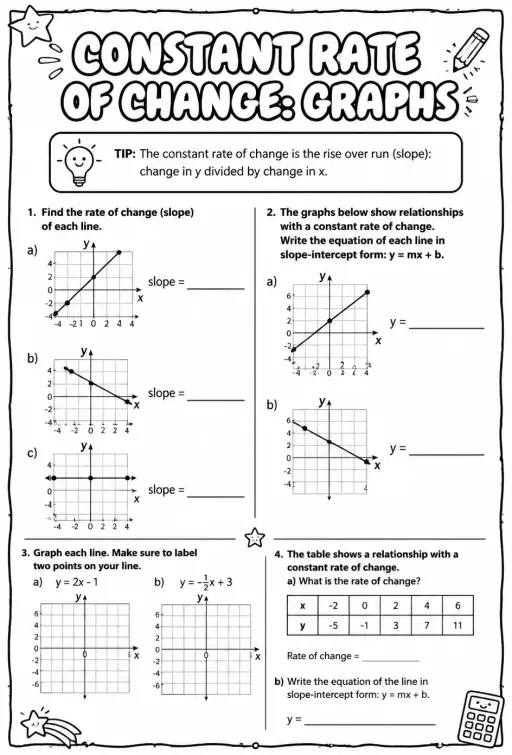
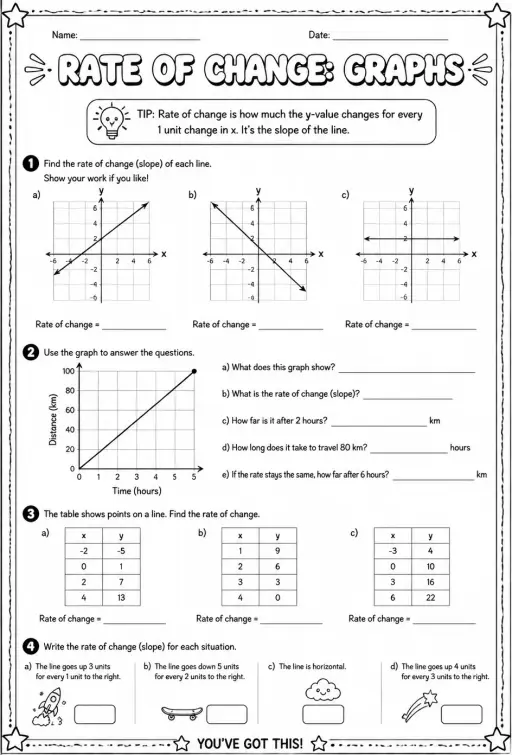
Students read rate-versus-time graphs, find signed area to determine net change, connect rate to accumulated total, and check units and assumptions in new situations.
Learning objective
Learners will interpret signed area, connect rates and totals, and evaluate units and assumptions, applying the connected skills to a new scenario.
How to play
Read each rate graph or scenario carefully. Use signed area above and below the axis to find net change, then connect that change to the starting total when needed. Some items ask you to listen to a teacher description before answering.
- Subject
- Mathematics
- Grade
- Grade 11
- Content language
- English
Topic tags
Compatible game modes
Play it as a game
Press Play, then pick a game under “Switch game”.
Solo games
- Build a Robot
- Colour the Picture
- Tower Stack
- Treasure Dive
- Goal Kick
- Balloon Pop
Team games
- Plinko
- Tug of War
- Team Penalties
- Bowling
- Mystery Boxes
- Team Race
- Tic Tac Toe
- Four in a Row
- Prize Wheel
- Ship Hunt
Watch KiwiBee on YouTube
Short KiwiBee videos for teachers and schools. Subscribe, or follow KiwiBee wherever you are.
 Home
 All solutions
 Pricing
 About us
 KiwiBee for Non-profits
 Events & webinars
 For big organisations
 For schools
 For centers
 For team leaders
 For teachers
 Resources
 Printable worksheets
 Interactive simulations
 Teacher tools
 Ideas and research


