KiwiBee printable
Rate of change: graphs
Free printable Grade 8 math worksheet for "Rate of change: graphs" — practice interpret functions. No-prep, print or assign online.
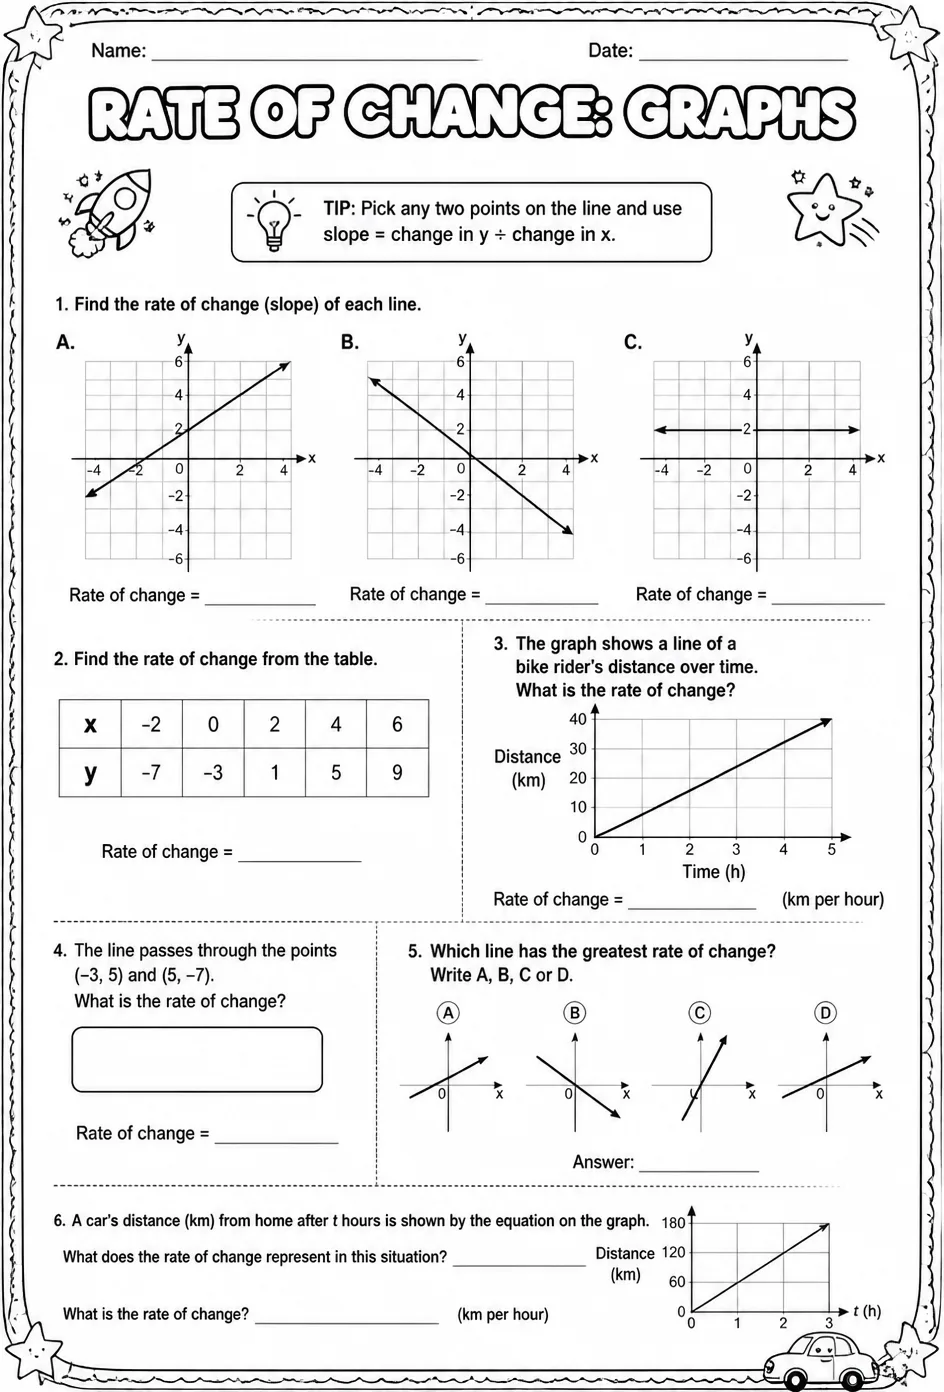
This worksheet helps students practice determining the rate of change by analyzing different graph types, including linear and non-linear functions. Teachers can use it to reinforce students' understanding of how the slope represents rate of change and to develop skills in interpreting graphical data. Ideal for middle school math classes focusing on function interpretation and graph analysis.
Learning objectives
- Calculate the rate of change from various types of graphs.
- Interpret the meaning of the rate of change in real-world contexts.
- Analyze linear and non-linear graphs to determine differences in rates of change.
How to use this worksheet
- Click “Download Worksheet” and sign in with Google or email to get the PDF instantly.
- Print at home or in class for Middle School; it's no-prep, with no extra materials needed.
- Hand it out as classwork, homework, or a quick warm-up.
Likes & comments
See what other teachers think and share a helpful note.
Loading likes and comments…
Create more worksheets in our Worksheet Studio
Generate fresh worksheets for any grade, topic, and language — free.
Open the Worksheet StudioRelated worksheets
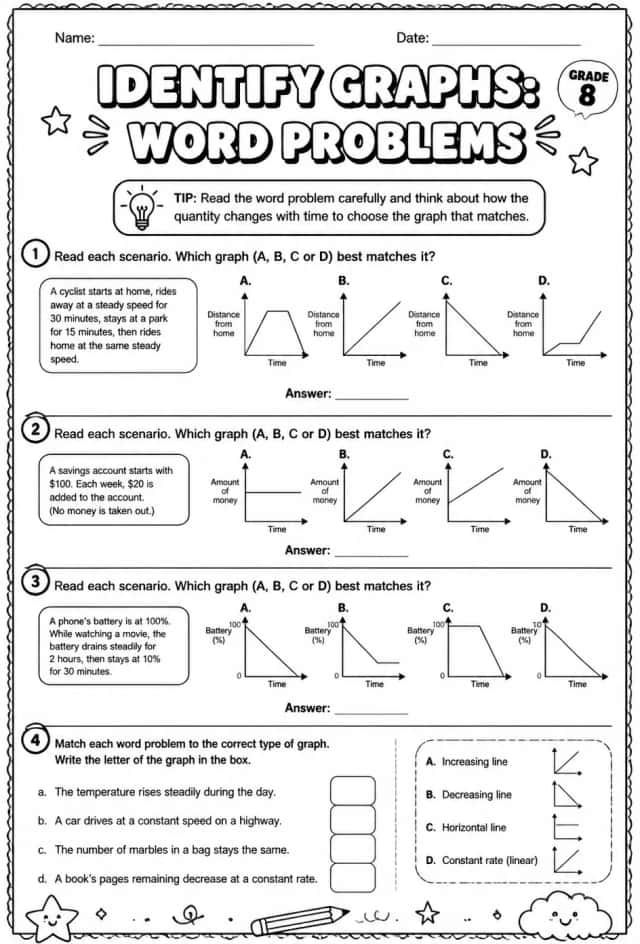
Identify graphs: word problems
Worksheets
hard
Ages 11–14
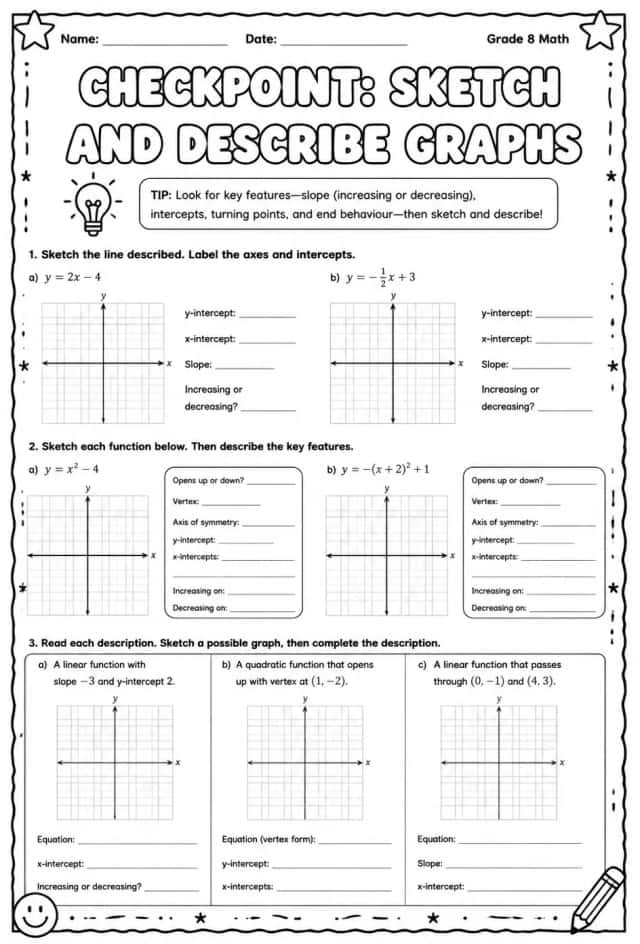
Checkpoint: Sketch and describe graphs
Worksheets
hard
Ages 11–14
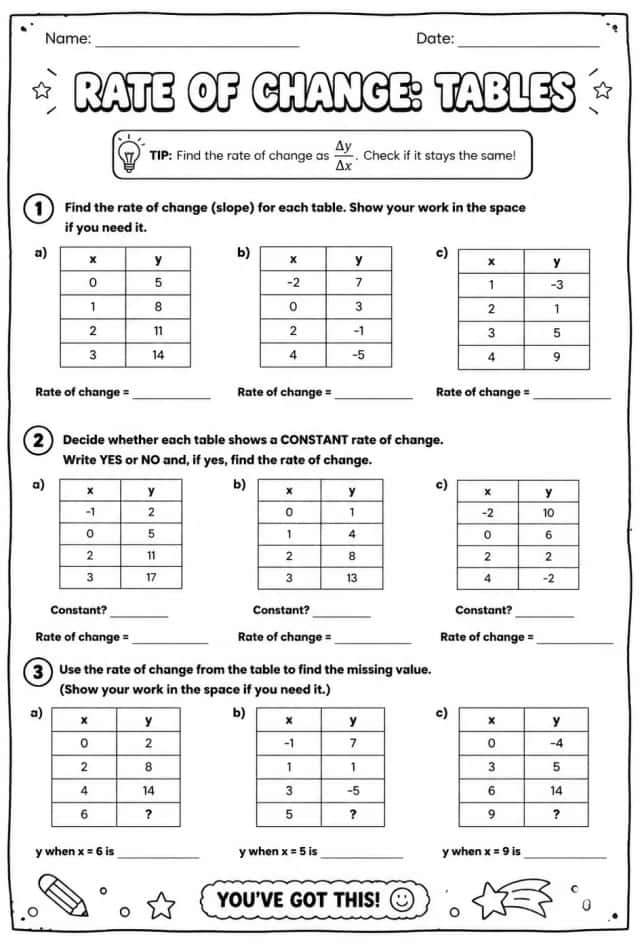
Rate of change: tables
Worksheets
hard
Ages 11–14
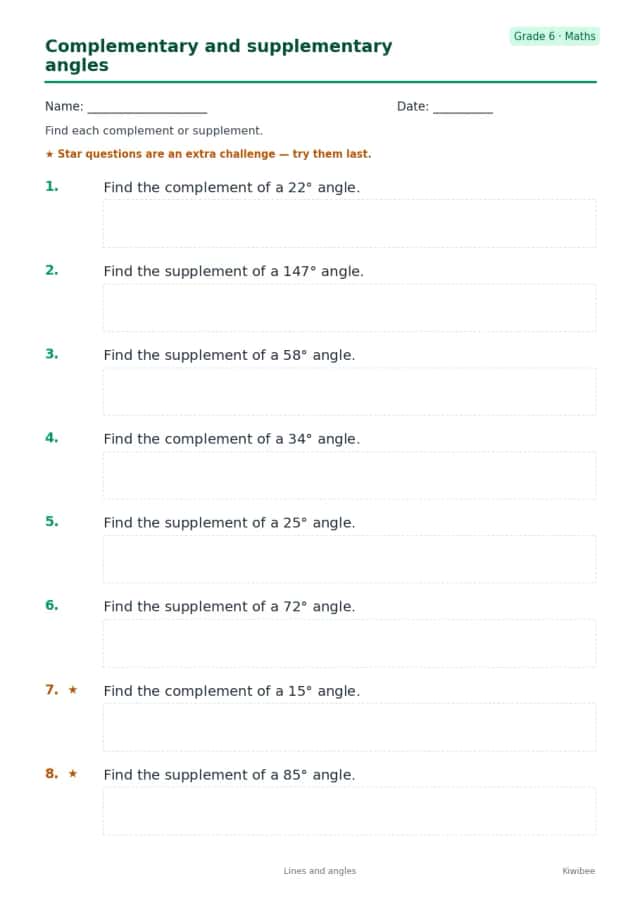
Complementary and supplementary angles
Worksheets
medium
Ages 11–14
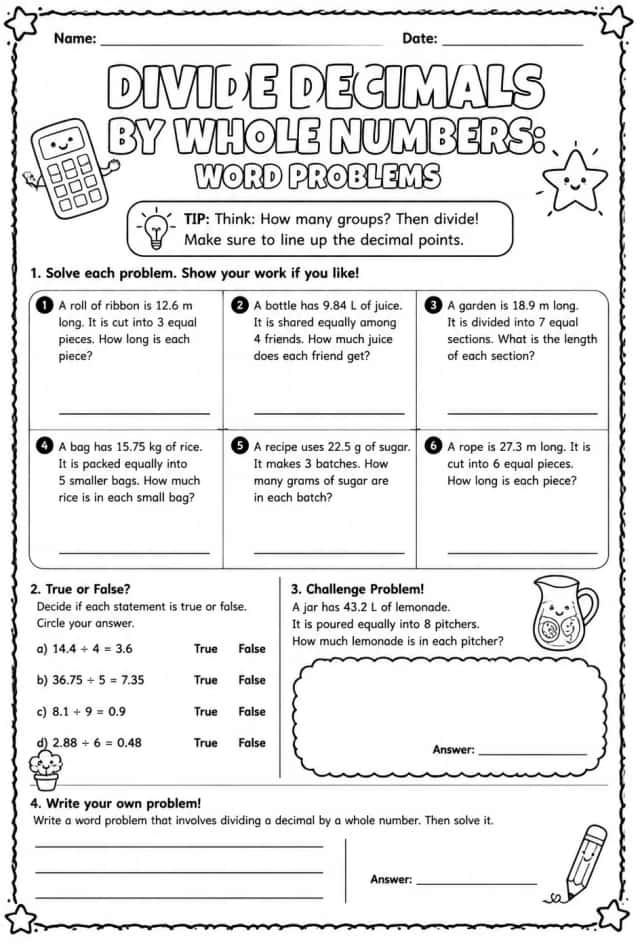
Divide decimals by whole numbers: word problems
Worksheets
hard
Ages 11–14
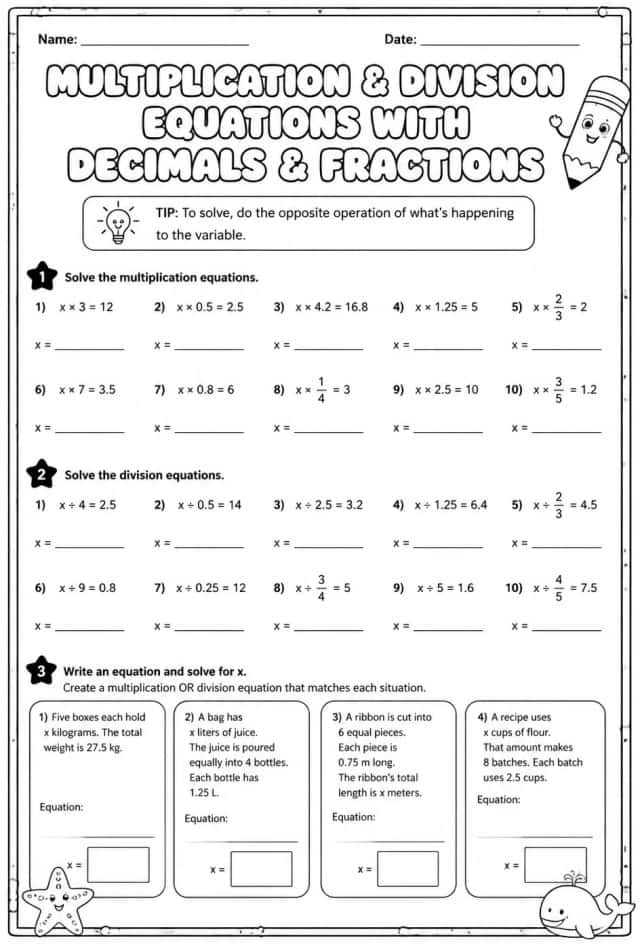
Solve one-step multiplication and division equations with decimals and fractions
Worksheets
hard
Ages 11–14
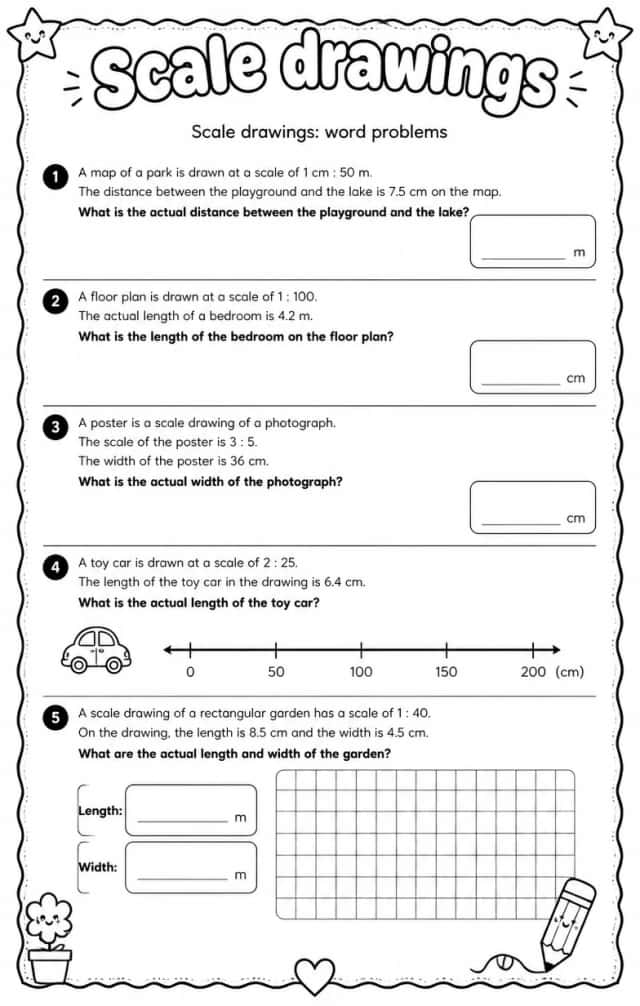
Scale drawings: word problems
Worksheets
hard
Ages 11–14
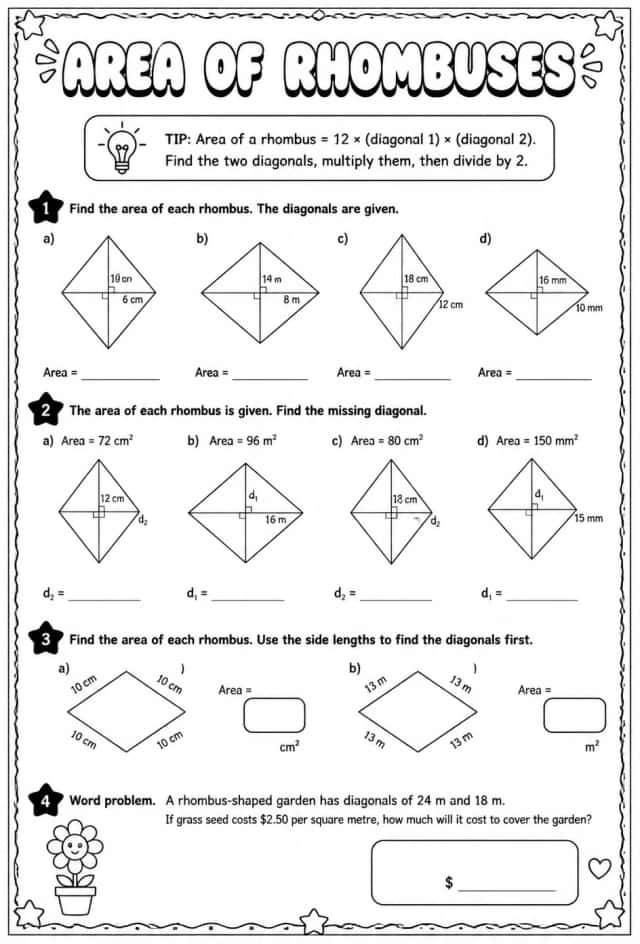
Area of rhombuses
Worksheets
hard
Ages 11–14