KiwiBee printable
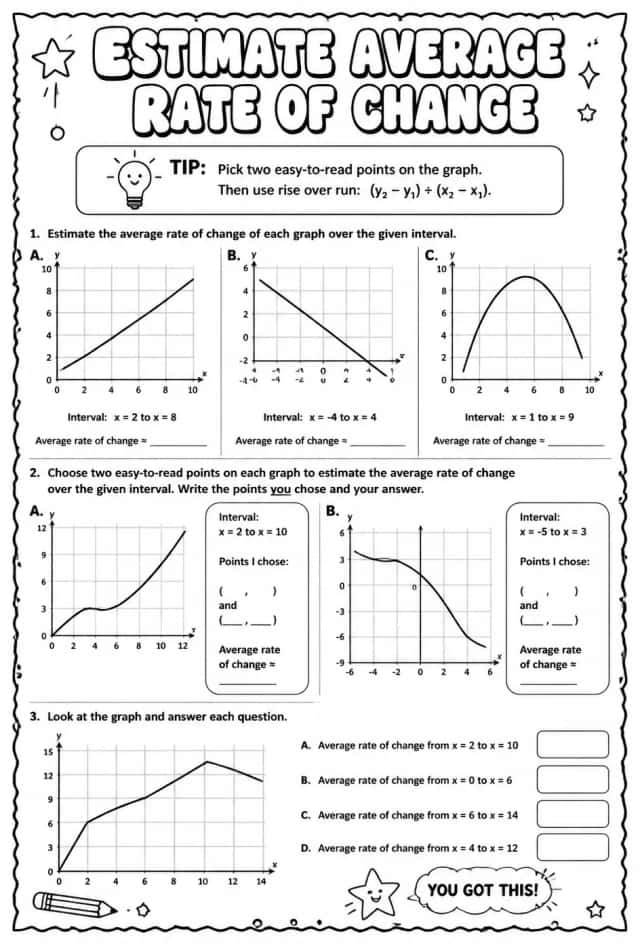
Rate of change: graphs
Free printable Algebra 1 math worksheet for "Rate of change: graphs" — practice function concepts. No-prep, print or assign online.
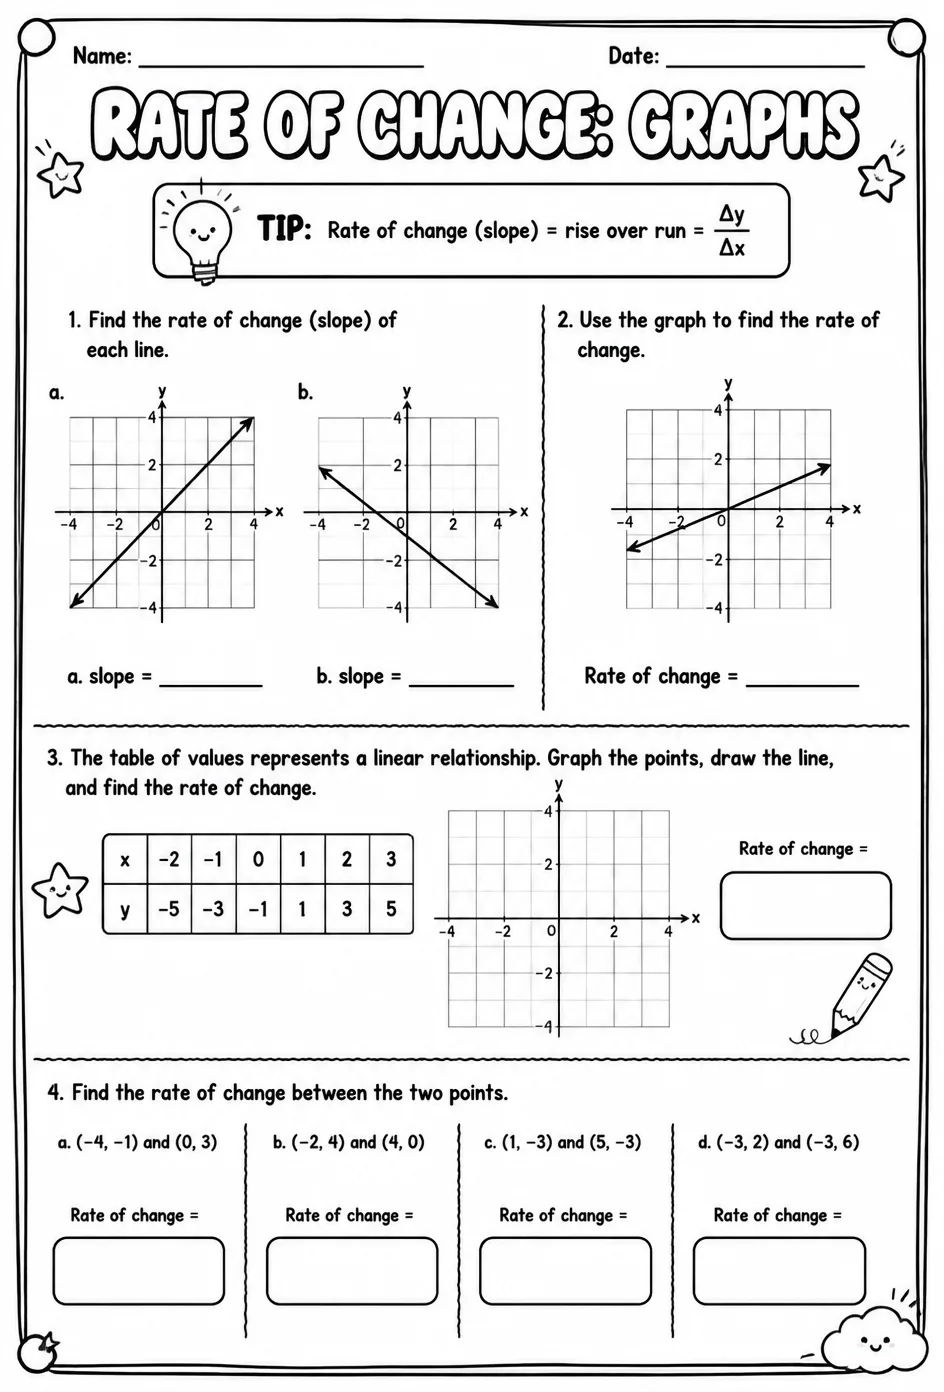
This worksheet provides challenging practice on determining the rate of change from graphs, focusing on both linear and nonlinear functions. Teachers can use it to reinforce students' understanding of slope and function behavior through visual analysis. Ideal for Algebra 1 classrooms, it supports skill development in interpreting and calculating rates of change, enhancing students' graph-reading proficiency.
Learning objectives
- Calculate the rate of change from various types of graphs representing linear and nonlinear functions.
- Interpret graphical representations to determine the slope and understand its significance in real-world contexts.
- Analyze changes in function values over intervals to describe the behavior of functions.
How to use this worksheet
- Click “Download Worksheet” and sign in with Google or email to get the PDF instantly.
- Print at home or in class for High School; it's no-prep, with no extra materials needed.
- Hand it out as classwork, homework, or a quick warm-up.
Likes & comments
See what other teachers think and share a helpful note.
Loading likes and comments…
Create more worksheets in our Worksheet Studio
Generate fresh worksheets for any grade, topic, and language — free.
Open the Worksheet StudioRelated worksheets
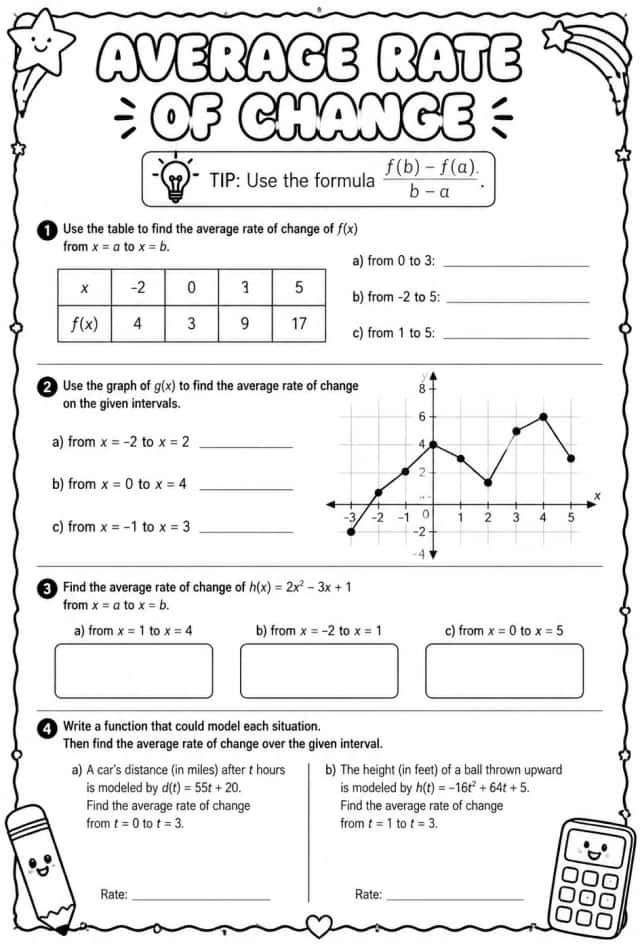
Average rate of change
Worksheets
hard
Ages 14–18
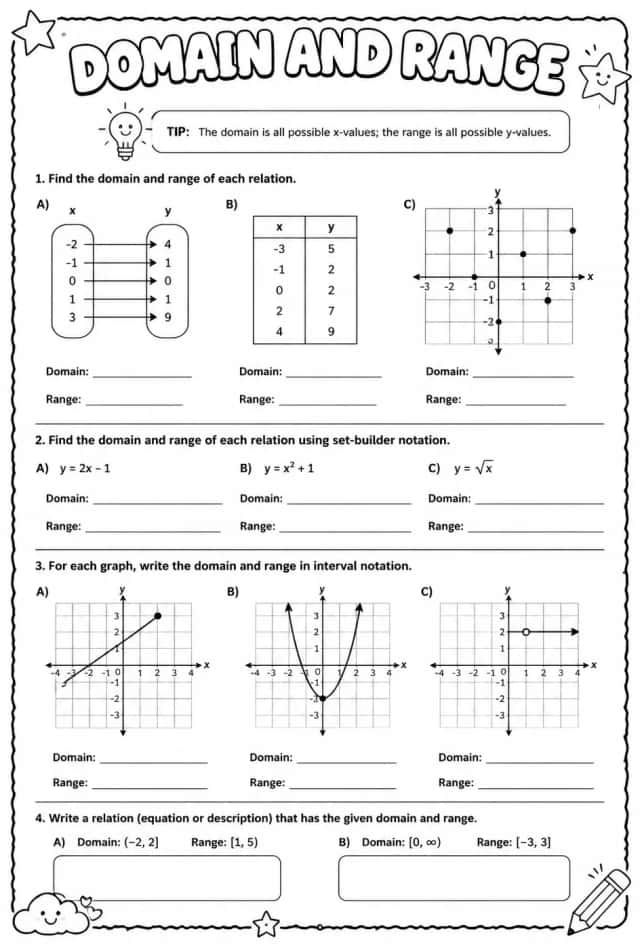
Domain and range
Worksheets
hard
Ages 14–18
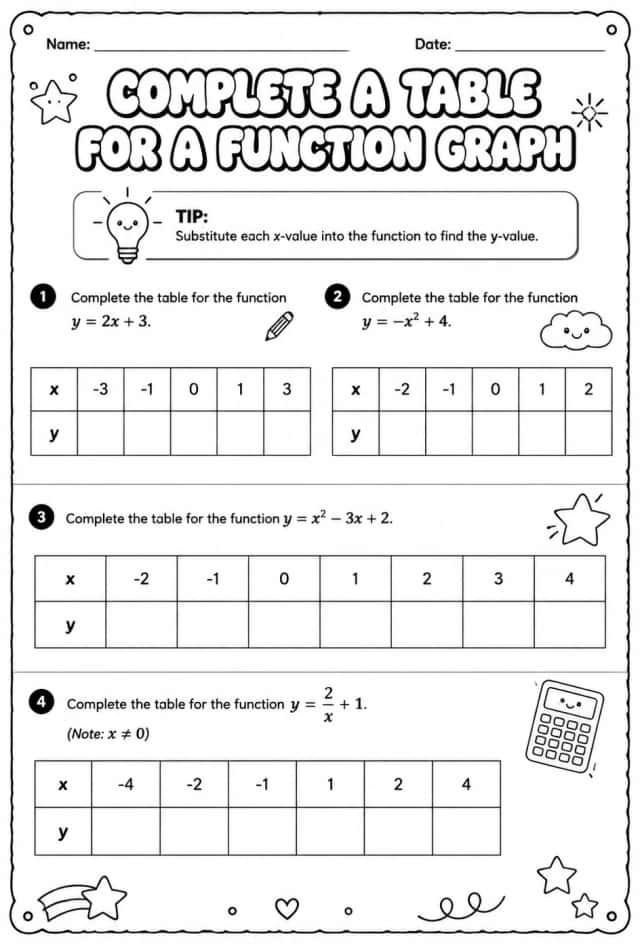
Complete a table for a function graph
Worksheets
hard
Ages 14–18
Estimate average rate of change from a graph
Worksheets
hard
Ages 14–18
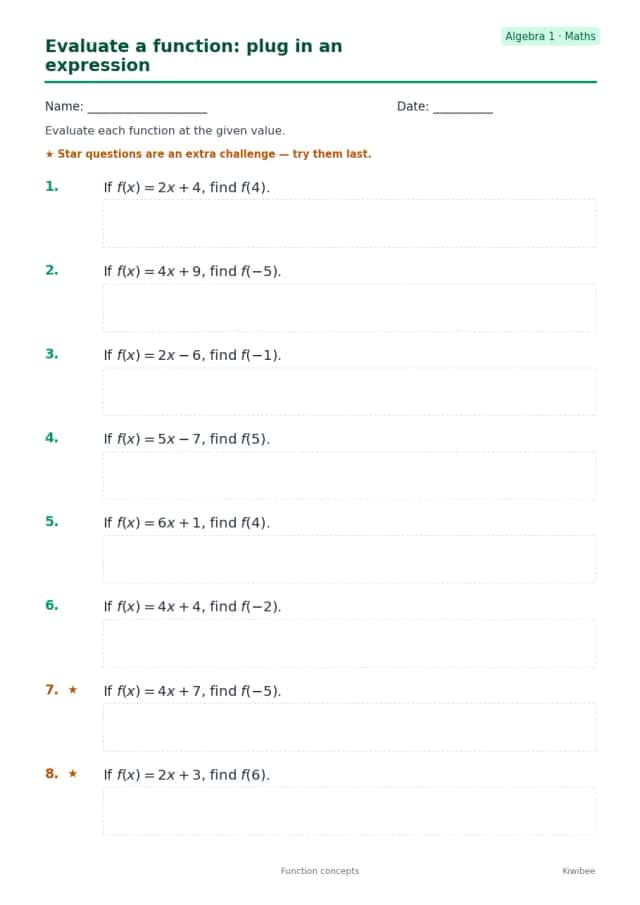
Evaluate a function: plug in an expression
Worksheets
medium
Ages 14–18
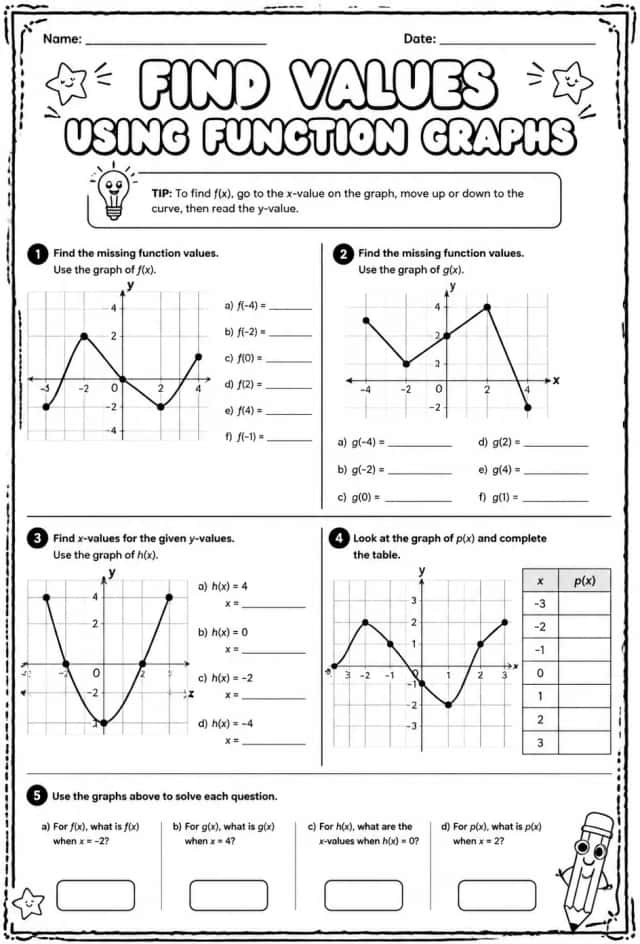
Find values using function graphs
Worksheets
hard
Ages 14–18
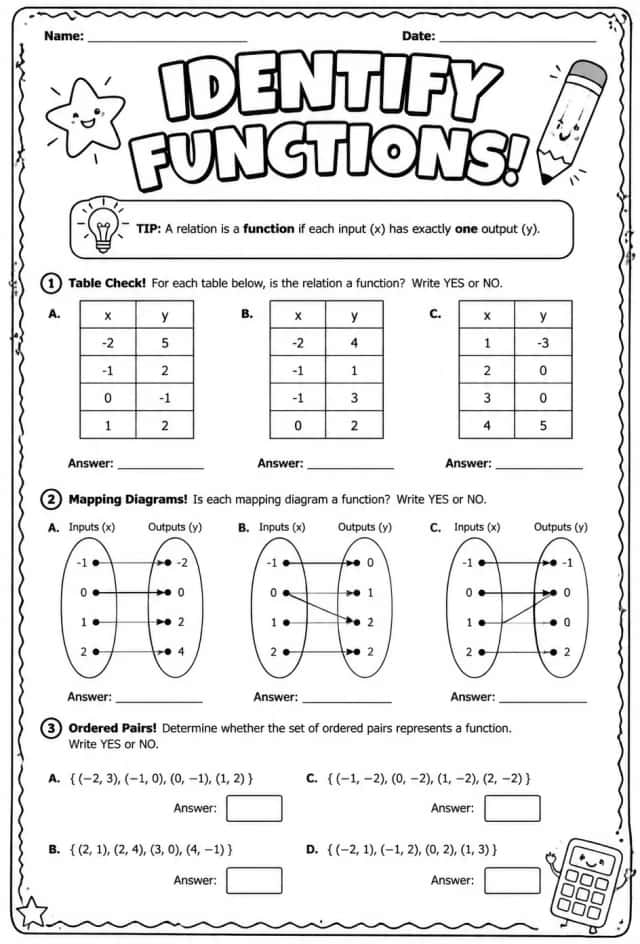
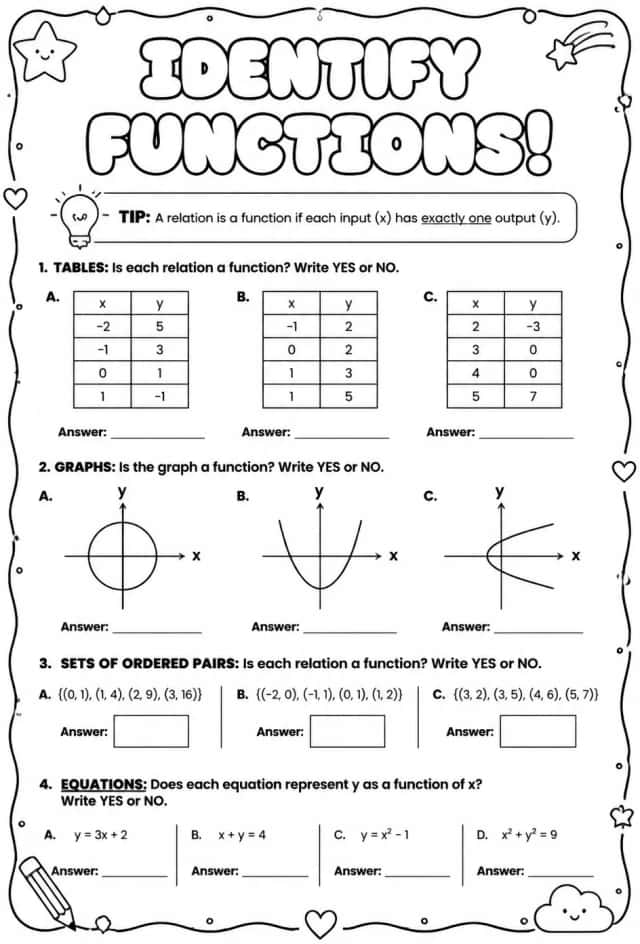
Identify functions
Worksheets
hard
Ages 14–18
Identify functions
Worksheets
hard
Ages 14–18