
Spin a spinner, flip a coin or roll a die and watch two sets of bars: the chances the shapes predict, and the results you actually got. Ten spins prove nothing; a few hundred and the two are hard to tell apart.
—
KiwiBee utilise des cookies facultatifs Google Analytics, Google Ads et Meta Pixel pour comprendre les visiteurs adultes, mesurer les inscriptions finalisées et améliorer ses campagnes. Les cookies essentiels restent toujours actifs. Le pixel publicitaire ChatGPT d’OpenAI mesure aussi les pages vues et les demandes envoyées après consentement publicitaire, et peut utiliser des coordonnées hachées pour la mise en correspondance. Politique de confidentialité
KiwiBee’s rebuilt classroom probability lab uses a uniform sample space and two event intervals. Change P(A), P(B) and their feasible overlap, collect reproducible random trials, and switch between the full population and a population conditioned on A or B. Exact probabilities appear beside observed sample proportions. Changing a parameter starts a fresh experiment; conditioning on a zero-probability event is explicitly undefined. Inspired by Victor Powell’s MIT-licensed Explained Visually activity, with credits to Victor Powell and Lewis Lehe.
Victor Powell; Explained Visually by Victor Powell and Lewis Lehe. Original source license: MIT. Source: https://github.com/vicapow/explained-visually. KiwiBee improves the classroom controls and experiments, retaining source credits and licenses.
The falling balls are random samples from a simplified model. Short runs fluctuate, and a conditional probability is undefined when its conditioning event has probability zero.
Use the activity controls inside the frame, or open fullscreen for a larger workspace. Ask students to predict a result, test it, and explain what changed. The embedded application starts in English; available upstream language controls are part of the original activity.
Placez-la dans votre ENT, votre blog ou le site de la classe — gratuitement.
<iframe src="https://kiwibee.io/fr/simulations/conditional-probability-visual-simulation/embed" title="Conditional Probability Visual Lab | KiwiBee" loading="lazy" allowfullscreen style="width:100%;height:min(70vh,620px);min-height:420px;border:0;border-radius:16px"></iframe>Continuer à explorer
Spin a spinner, flip a coin or roll a die and watch two sets of bars: the chances the shapes predict, and the results you actually got. Ten spins prove nothing; a few hundred and the two are hard to tell apart.

Type any function and see its shape straight away. Plot up to three at once in three colours to compare them, drag the trace point to read a value off a curve, and see where each one crosses zero.

Move m and watch the line tilt; move b and watch it slide. Or drag the two points on the line and read the equation it writes back. A rise-over-run staircase climbs the line so slope becomes something you can count.
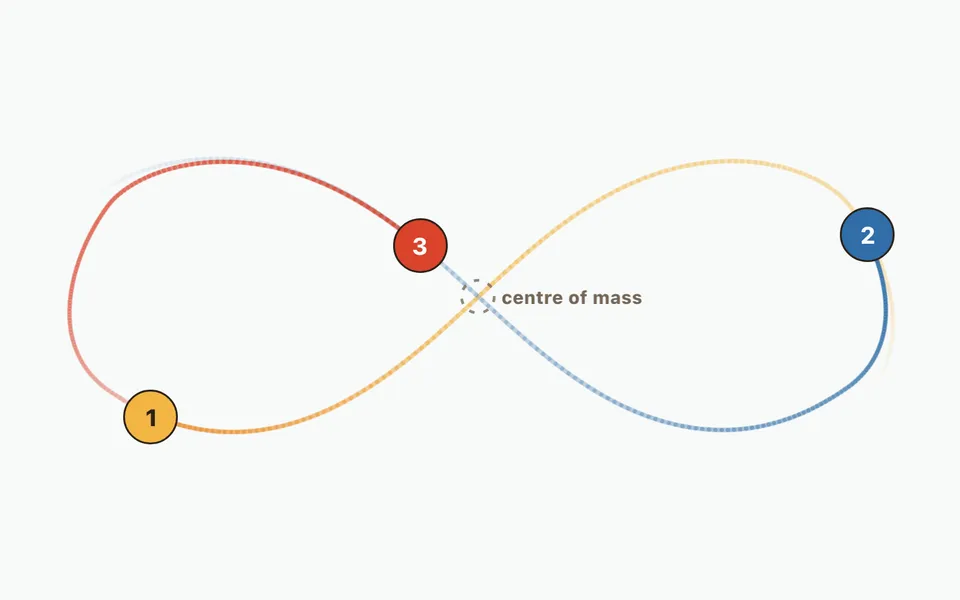
Compare a two-body orbit with three-body figure-eight motion, then add up to twelve bodies. Change initial masses, velocities and positions; watch orbit trails and numerical energy error.

Approximate the area under a curve with strips and choose how each takes its height: left edge, right edge, middle, or a sloping top. Push the strip count up and watch the error fall, with the running total plotted as its own curve.
Du modèle à la trace écrite
Utilisez une fiche pour recueillir les prédictions, les observations et les explications après l'exploration des élèves.
L'espace enseignant gratuit de KiwiBee réunit au même endroit la préparation des séances, les fiches, les outils de classe et le carnet de notes.
Commencez gratuitement et créez votre première classe Accueil
 Toutes les solutions
 Tarifs
 À propos
 KiwiBee pour les associations
 Événements et webinaires
 Pour les grands réseaux
 Pour les établissements
 Pour les centres
 Pour les responsables d'équipe
 Pour les enseignants
 IA et ressources
 Ressources
 Fiches imprimables
 Kits de cours
 Simulations interactives
 Outils pour les enseignants
 Studio IA
 Idées et recherche