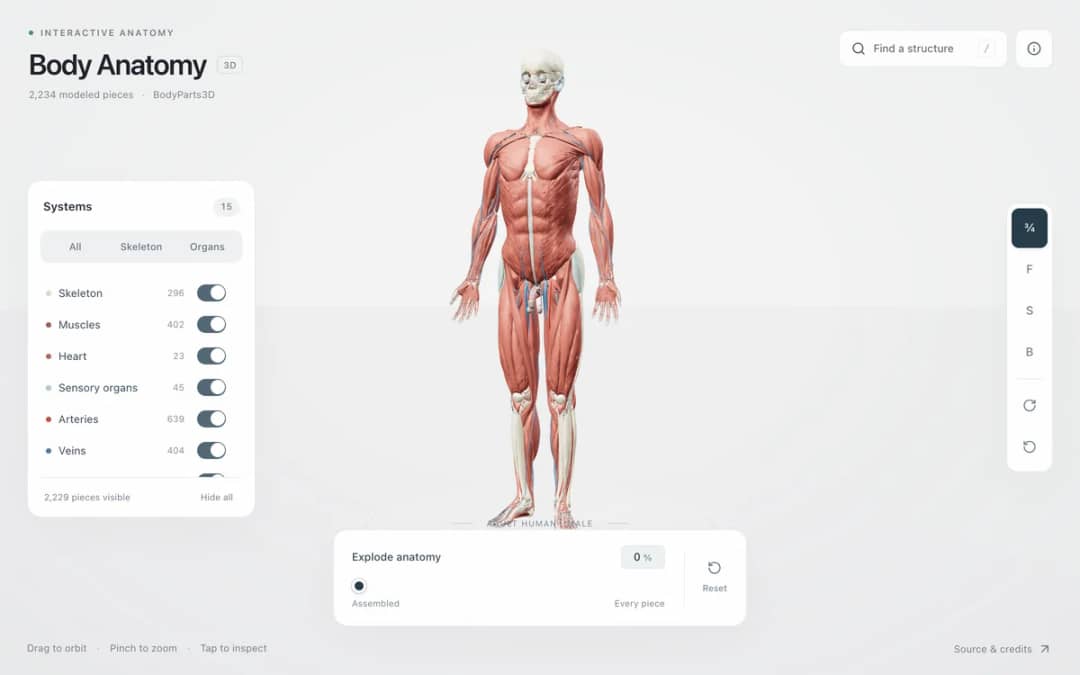
Explore an adult male reference body in 3D. Reveal 14 anatomical systems, search thousands of named structures, isolate organs, and pull 2,209 modeled pieces apart to see how the body is organized.
—
KiwiBee uses optional Google Analytics, Google Ads, and Meta Pixel cookies to understand adult visitors, measure completed sign-ups, and improve campaigns. Essential cookies always stay on. OpenAI’s ChatGPT Ads Pixel also measures page views and completed enquiries after advertising consent, and may use hashed contact details for matching. Privacy policy
Ripple Interference shows two in-phase sources producing circular waves on a grid about 28 meters wide. Students change the frequency and the separation, and can highlight the bright lines where crests meet crests. Readouts give the wavelength, the number of bright lines and the number of calm lines. It teaches superposition, constructive and destructive interference, and how path difference determines the pattern, and prepares students for double-slit ideas in light and sound.
Yes. It is free, requires no sign-up and runs in any modern browser, including classroom whiteboards and tablets.
Along those lines a crest from one source arrives with a trough from the other, so they cancel. The path difference there is a half wavelength plus a whole number of wavelengths.
Set the frequency and the separation of the two sources, then toggle the bright lines. Drag to orbit the water and read the wavelength and line counts.
The lines spread farther apart and fewer of them fit on the surface. With a separation smaller than one wavelength only a single bright line remains.
Drop it into your LMS, blog, or class site — free.
<iframe src="https://kiwibee.io/en/simulations/ripple-interference-3d-simulation/embed" title="Ripple Interference | KiwiBee" loading="lazy" allowfullscreen style="width:100%;height:min(70vh,620px);min-height:420px;border:0;border-radius:16px"></iframe>Continue exploring
Explore an adult male reference body in 3D. Reveal 14 anatomical systems, search thousands of named structures, isolate organs, and pull 2,209 modeled pieces apart to see how the body is organized.
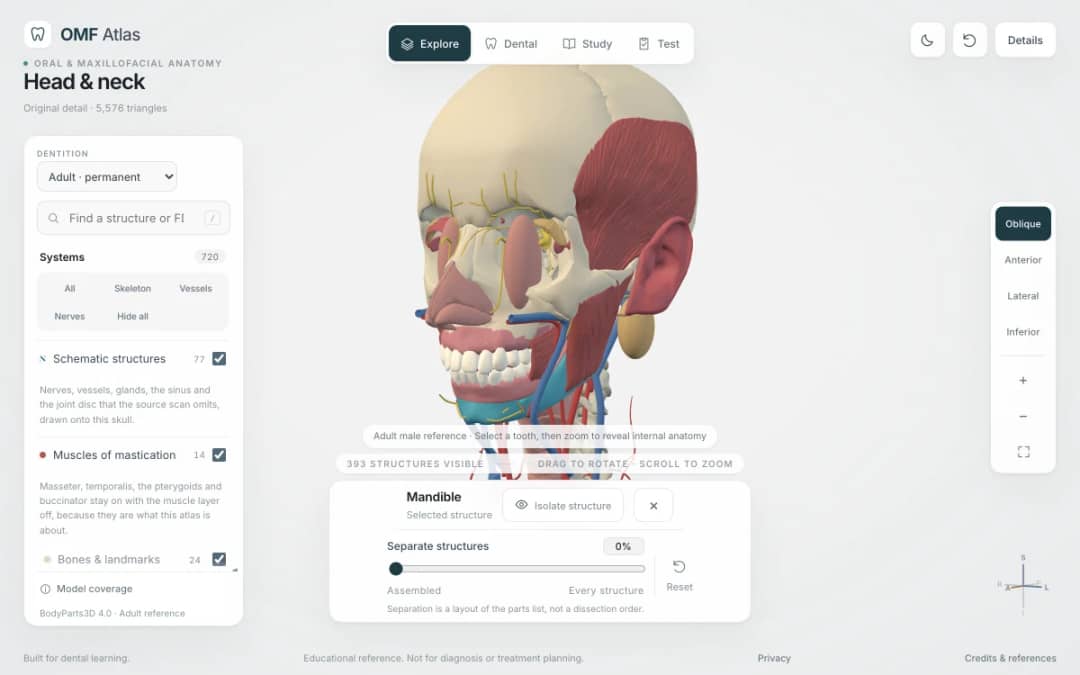
Explore the head and neck in 3D: 643 source meshes across 14 layers, 47 facial and masticatory muscles, and 77 drawn nerves, vessels and glands the source scan omits. Open any tooth onto its own pulp canal, and follow the seven stages of tooth development.

Free interactive photosynthesis simulation. Explore photosynthesis hands-on online — great for whole-class or independent practice.

Free interactive states of matter simulation. Explore states of matter hands-on online — great for whole-class or independent practice.

Free interactive shadows simulation. Explore shadows hands-on online — great for whole-class or independent practice.
From model to evidence
Use a worksheet to capture predictions, observations, and explanations after students explore.
KiwiBee's free teacher workspace brings lesson planning, worksheets, classroom tools, and gradebook together in one place.
Start free and create your first class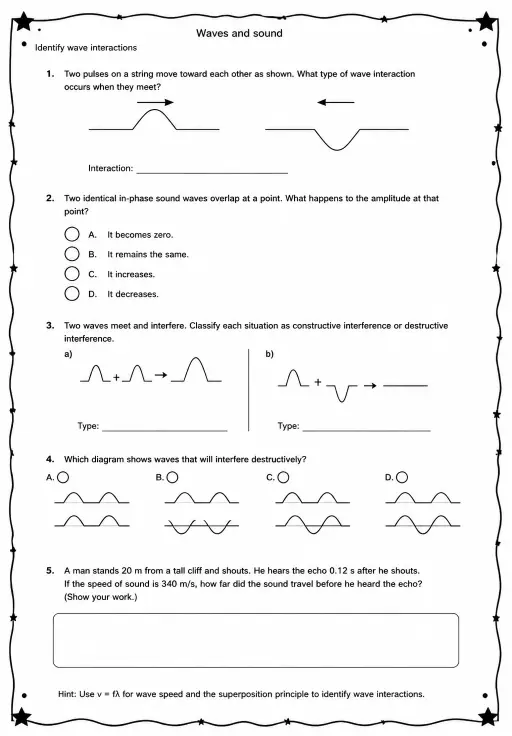
 Home
 All solutions
 Pricing
 About us
 KiwiBee for Non-profits
 Events & webinars
 For big organisations
 For schools
 For centers
 For team leaders
 For teachers
 AI and resources
 Resources
 Printable worksheets
 Lesson Packs
 Interactive simulations
 Teacher tools
 AI studio
 Ideas and research