
Quadratic Handles
- Math
Comments
Related to this simulation
Picked by meaning from games, worksheets, simulations, teacher tools and videos.
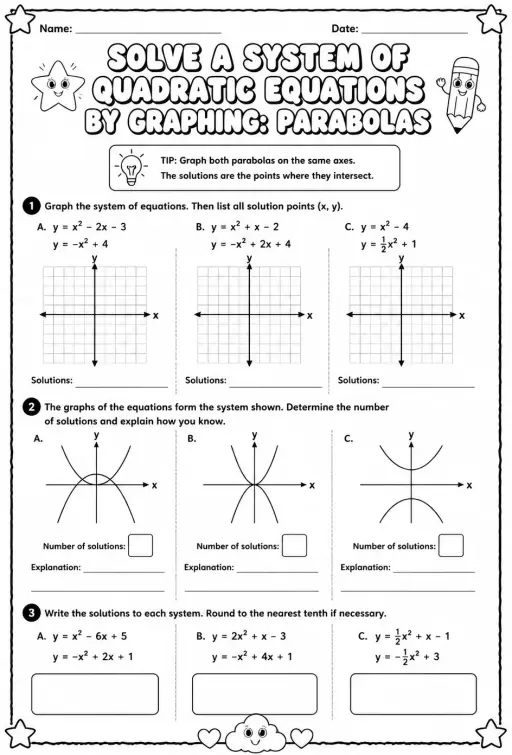 WorksheetSolve a system of quadratic equations by graphing: parabolas
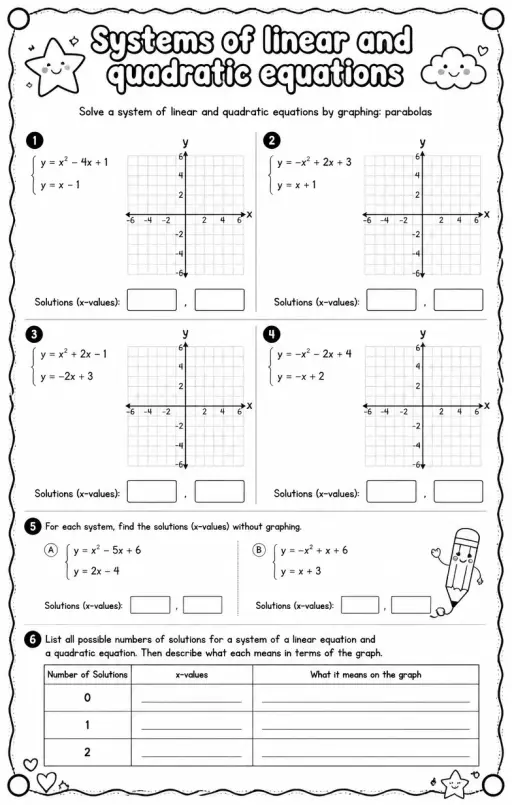 WorksheetSolve a system of linear and quadratic equations by graphing: parabolas
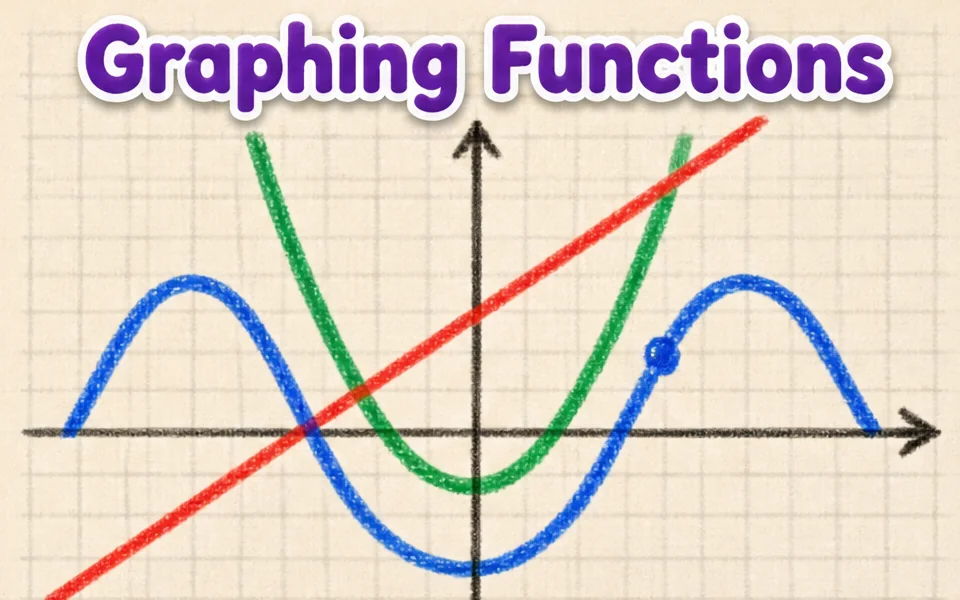 SimulationFunction Grapher
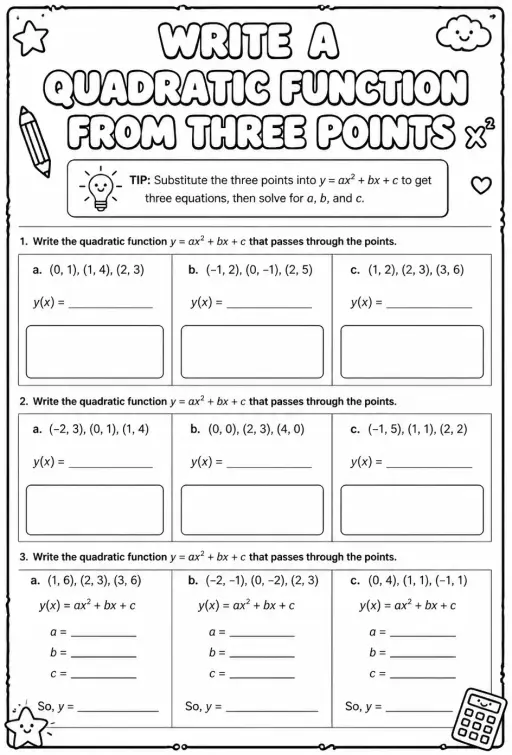 WorksheetWrite a quadratic function from three points
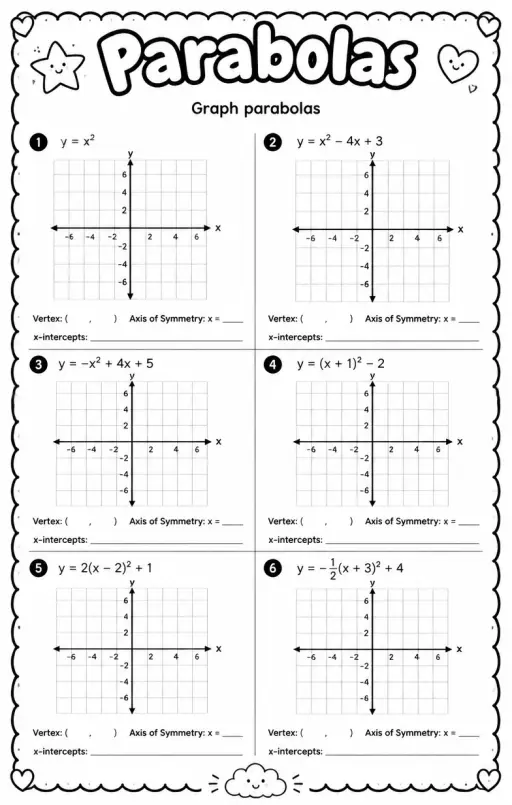 WorksheetGraph parabolas
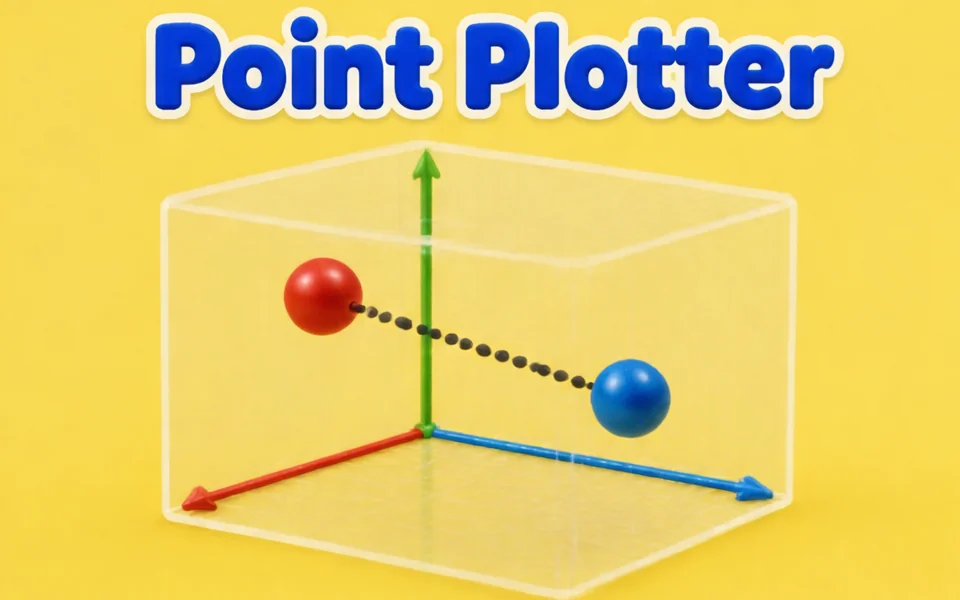 Simulation3D Point Plotter
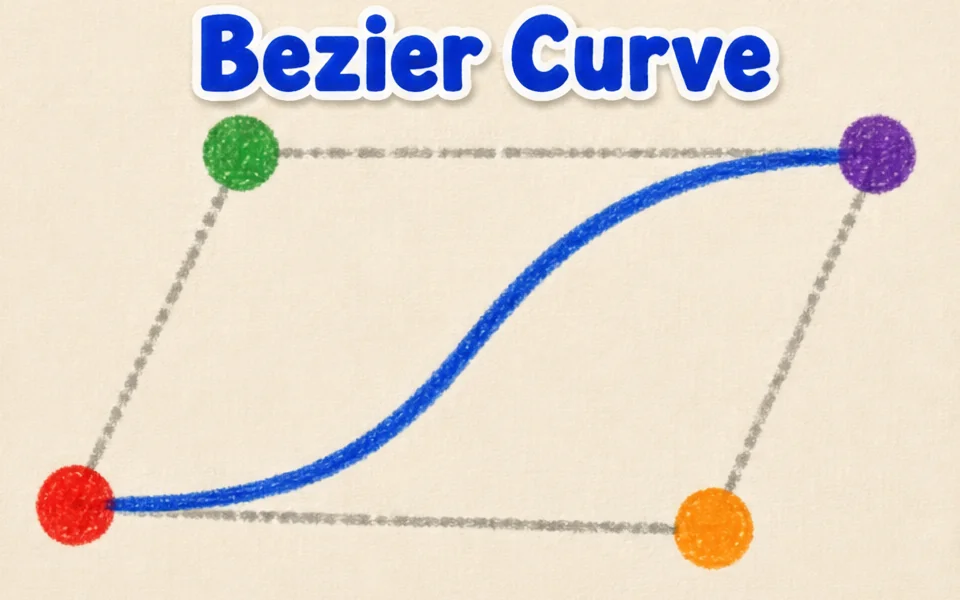 SimulationBezier Curve Editor
About this simulation
Quadratic Handles draws the unique parabola through three draggable points. As students move a point in half-unit steps, the readouts show the equation y equals ax squared plus bx plus c, the vertex, the discriminant D, the roots and the vertex form. Toggles show or hide the vertex, roots and the axis of symmetry, and Next example loads a prepared set of points. If the points line up, a becomes zero and the curve becomes a line. It connects the graph to the algebra and helps students see how roots, vertex and discriminant relate.
What students can explore
- Drag one point up and down and watch the Equation and Vertex readouts update.
- Move the points until the parabola just touches the x axis and read the discriminant D.
- Arrange the points so the parabola crosses the x axis twice and compare the two Roots.
- Switch the Symmetry axis on and see how the vertex sits on it.
- Line up the three points and see what happens to the curve and the value of a.
Learning objectives
- 1Explain that three points with different x values determine one parabola.
- 2Relate the discriminant to the number of x-axis crossings.
- 3Locate the vertex and axis of symmetry from a graph.
- 4Connect standard form and vertex form of the same parabola.
Questions teachers ask
Is it free?
Yes. There is no sign-up or download. It runs in the browser on laptops, interactive whiteboards, tablets and phones.
What does the discriminant tell me?
D equals b squared minus 4ac. If D is positive the parabola crosses the x axis twice, if it is zero it touches once, and if it is negative it never reaches the axis.
Why do the points need different x values?
A function can have only one y value for each x. Two points with the same x would not lie on any parabola of this form, so the simulation keeps them apart.
How do I find the vertex?
Read the Vertex readout, or turn on Show vertex and roots to see it marked. Its x value is minus b divided by 2a, and the axis of symmetry passes through it.
Embed this simulation
Drop it into your LMS, blog, or class site — free.
<iframe src="https://kiwibee.io/en/simulations/quadratic-handles-3d-simulation/embed" title="Quadratic Handles | KiwiBee" loading="lazy" allowfullscreen style="width:100%;height:min(70vh,620px);min-height:420px;border:0;border-radius:16px"></iframe>Curriculum standards
Cambridge
- 9As.07Read, draw and interpret graphs and use compound measures to compare graphs.Cambridge Lower Secondary Mathematics (0862) — Stage 9 › Algebra › Sequences, functions and graphs
Learning objectives © UCLES (Cambridge University Press & Assessment), quoted with attribution.
Bring interactive science into your classroom
KiwiBee's free teacher workspace brings lesson planning, worksheets, classroom tools, and gradebook together in one place.
Start free and create your first classWatch KiwiBee on YouTube
Short KiwiBee videos for teachers and schools. Subscribe, or follow KiwiBee wherever you are.
 Home
 All solutions
 Pricing
 About us
 KiwiBee for Non-profits
 Events & webinars
 For big organisations
 For schools
 For centers
 For team leaders
 For teachers
 Resources
 Printable worksheets
 Interactive simulations
 Teacher tools
 Ideas and research


