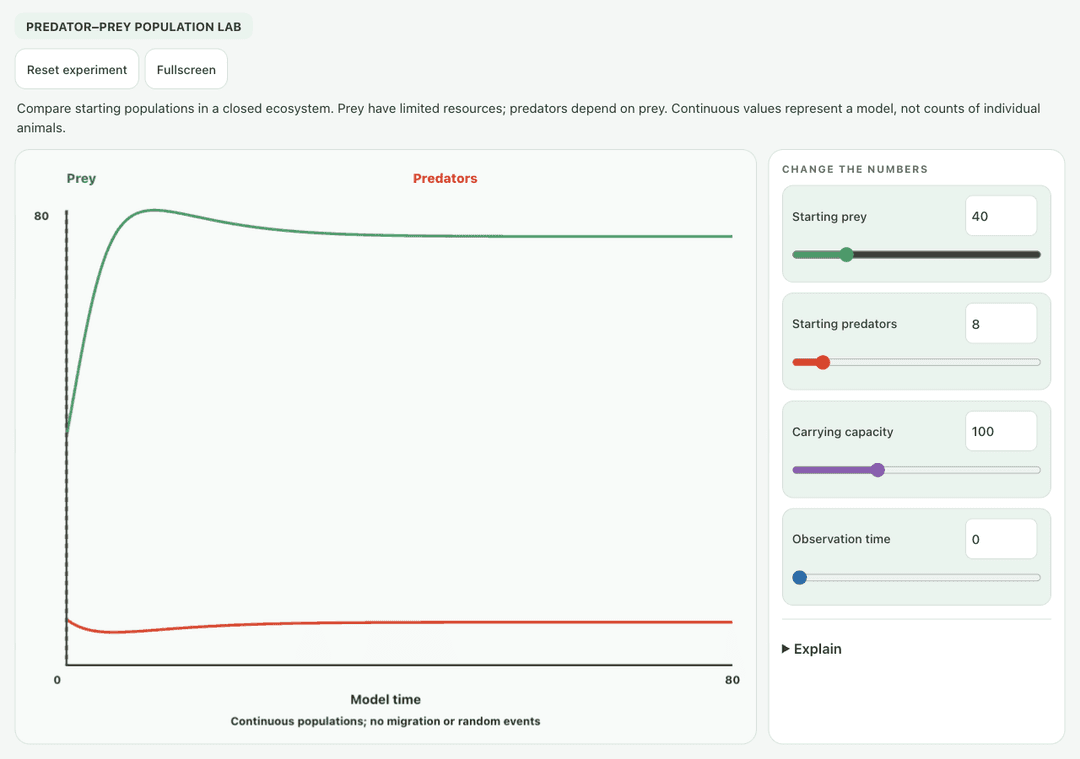
Compare starting populations in a closed ecosystem. Prey have limited resources; predators depend on prey. Continuous values represent a model, not counts of individual animals.
—
KiwiBee uses optional Google Analytics, Google Ads, and Meta Pixel cookies to understand adult visitors, measure completed sign-ups, and improve campaigns. Essential cookies always stay on. OpenAI’s ChatGPT Ads Pixel also measures page views and completed enquiries after advertising consent, and may use hashed contact details for matching. Privacy policy
This ecosystem model treats every rabbit and fox as an individual agent. Foxes chase the nearest rabbit they see, gain energy from each kill, reproduce at full energy and starve at none, while rabbits flee and breed under a grass limit. A graph plots both populations over the last few minutes, and readouts show counts, rabbits per fox and rabbits eaten. Sliders and buttons let students test ideas about birth rates and sudden changes, making it ideal for showing lagged population cycles like the lynx and hare data.
Yes. It is free to use in any modern browser, including on whiteboards and tablets. No sign-up or download is required.
Plenty of prey lets predators multiply. More predators then eat down the prey, so predators starve and fall in number, and the prey recover. The cycle repeats with predators lagging behind prey.
Press Release 5 foxes or Add 40 rabbits at any time, or move the Rabbit birth rate and Fox gain per rabbit sliders. Watch the graph to see how long the system takes to settle.
Every animal is an individual agent with its own chance events, so the curves wobble instead of following the clean Lotka-Volterra equations. If a species dies out, a few immigrants arrive so the demo continues.
Drop it into your LMS, blog, or class site — free.
<iframe src="https://kiwibee.io/en/simulations/predator-prey-3d-simulation/embed" title="Predator and Prey | KiwiBee" loading="lazy" allowfullscreen style="width:100%;height:min(70vh,620px);min-height:420px;border:0;border-radius:16px"></iframe>Continue exploring
Compare starting populations in a closed ecosystem. Prey have limited resources; predators depend on prey. Continuous values represent a model, not counts of individual animals.
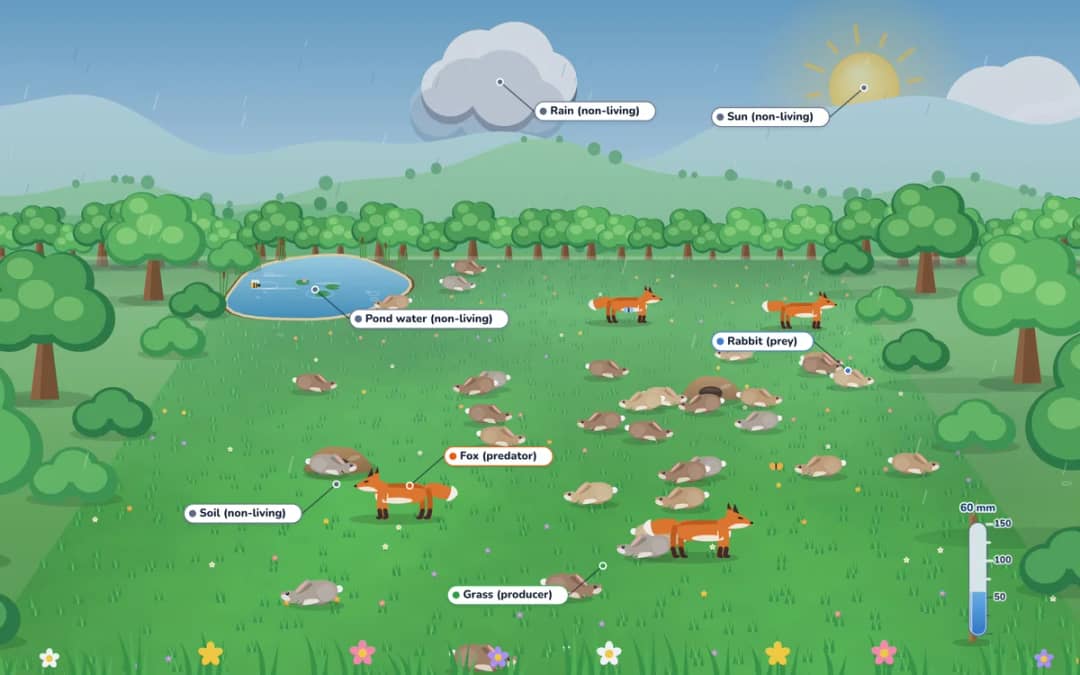
A living meadow valley where grass feeds the rabbits and rabbits feed the foxes. Change the rain, add or remove animals, and watch the populations rise and fall through drought, wildfire, disease and recovery.
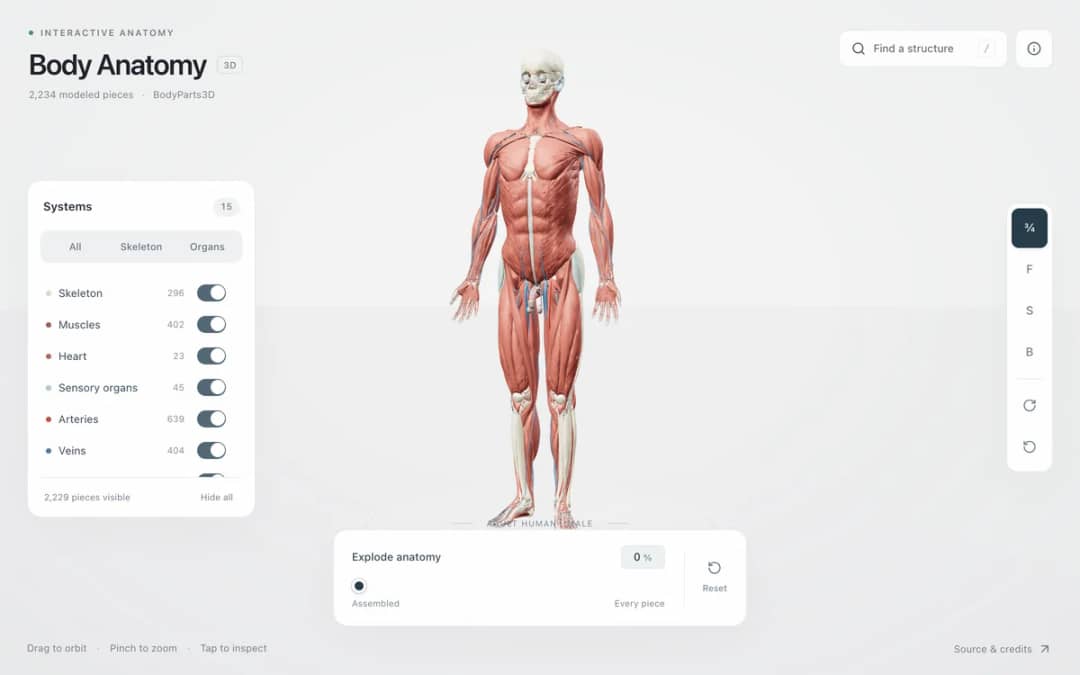
Explore an adult male reference body in 3D. Reveal 14 anatomical systems, search thousands of named structures, isolate organs, and pull 2,209 modeled pieces apart to see how the body is organized.
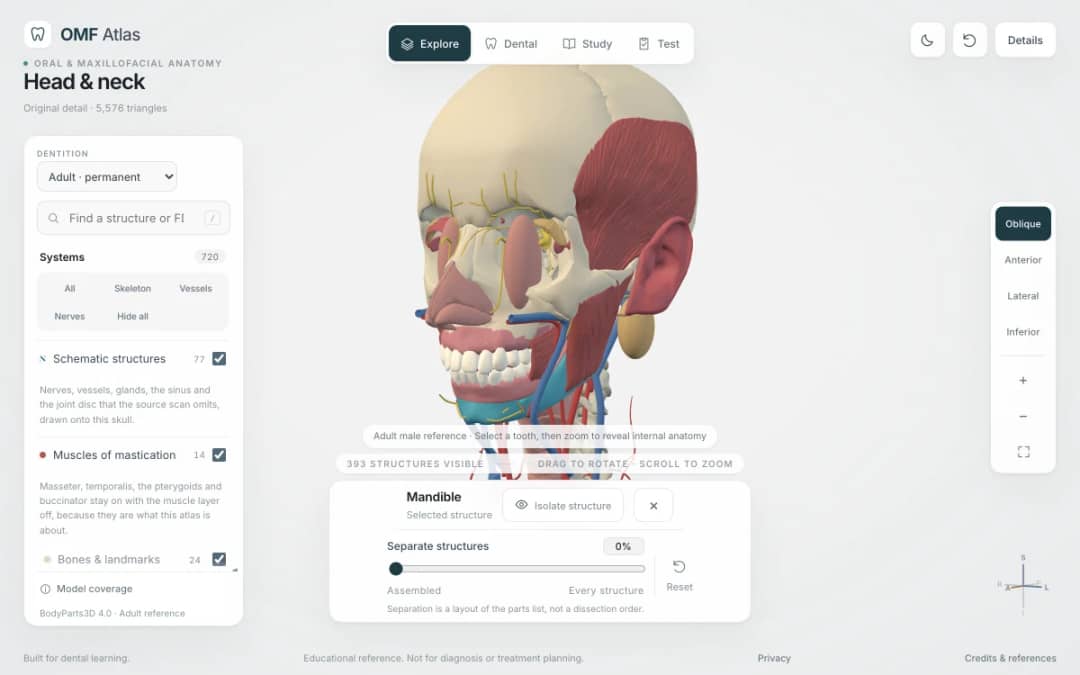
Explore the head and neck in 3D: 643 source meshes across 14 layers, 47 facial and masticatory muscles, and 77 drawn nerves, vessels and glands the source scan omits. Open any tooth onto its own pulp canal, and follow the seven stages of tooth development.

Free interactive photosynthesis simulation. Explore photosynthesis hands-on online — great for whole-class or independent practice.
From model to evidence
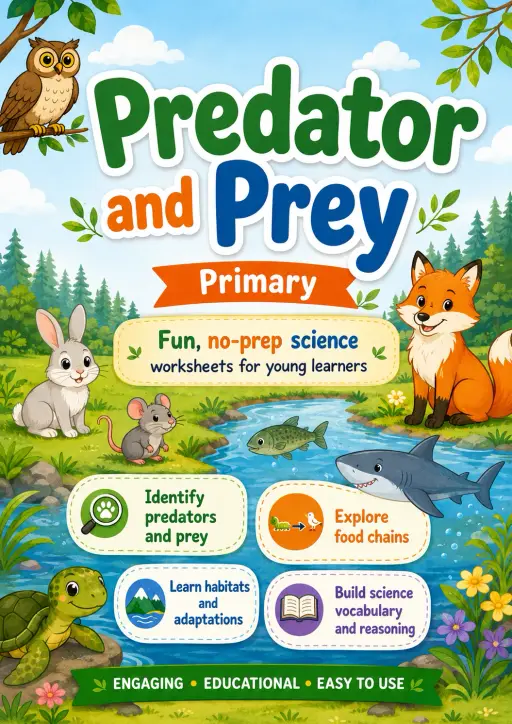
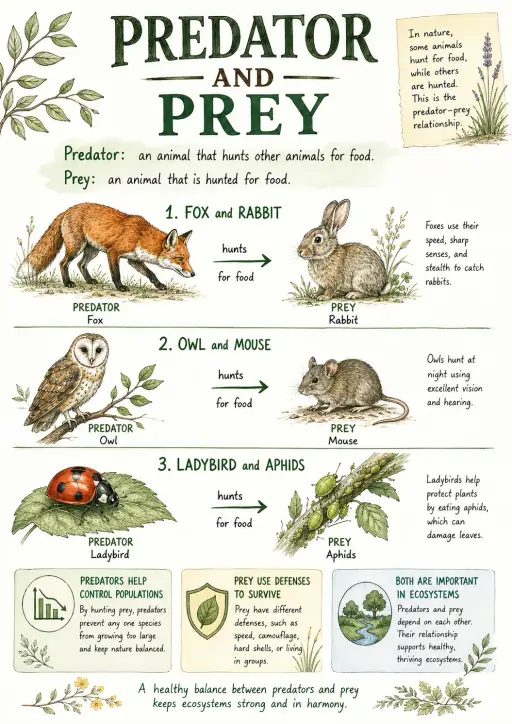
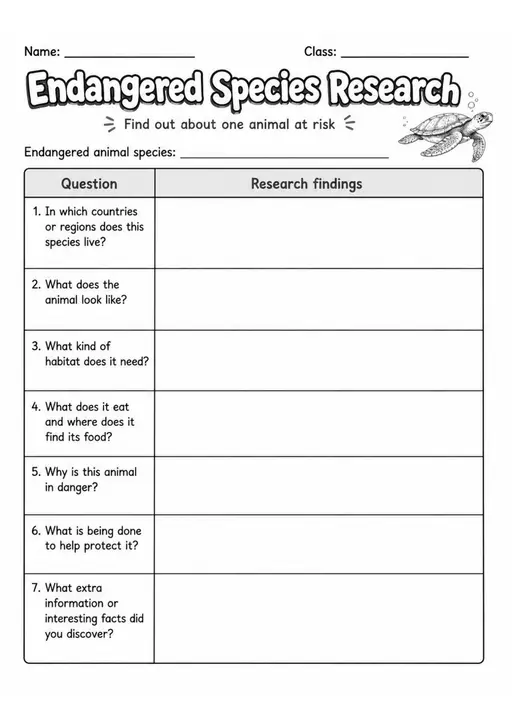
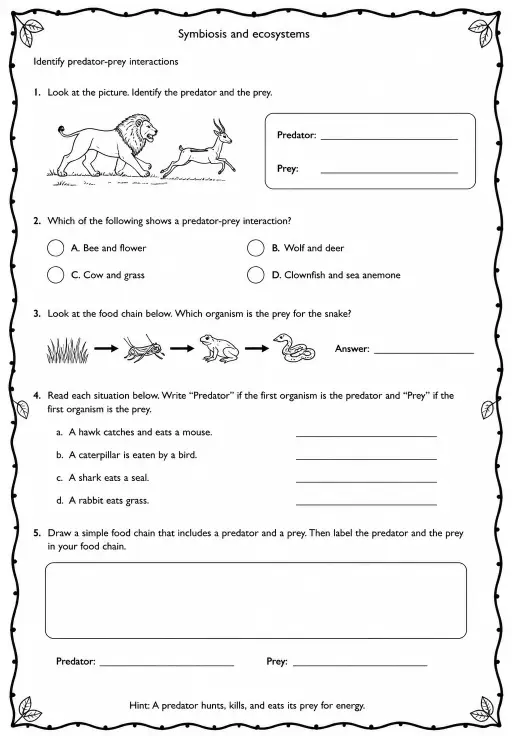
Use a worksheet to capture predictions, observations, and explanations after students explore.
KiwiBee's free teacher workspace brings lesson planning, worksheets, classroom tools, and gradebook together in one place.
Start free and create your first class Home
 All solutions
 Pricing
 About us
 KiwiBee for Non-profits
 Events & webinars
 For big organisations
 For schools
 For centers
 For team leaders
 For teachers
 AI and resources
 Resources
 Printable worksheets
 Lesson Packs
 Interactive simulations
 Teacher tools
 AI studio
 Ideas and research