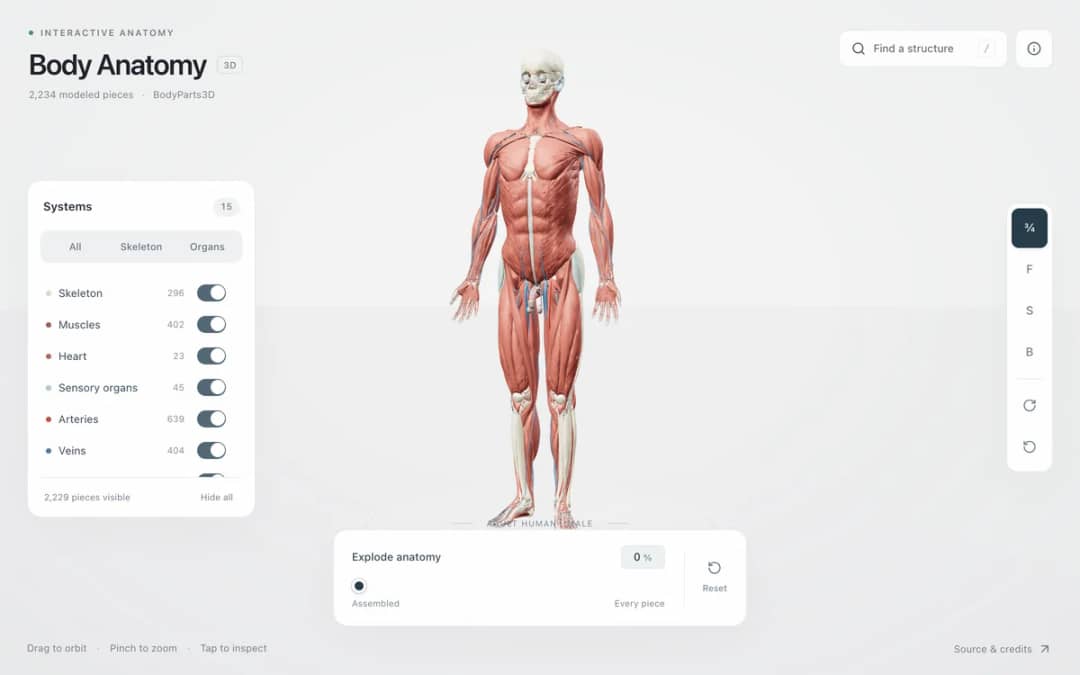
Explore an adult male reference body in 3D. Reveal 14 anatomical systems, search thousands of named structures, isolate organs, and pull 2,209 modeled pieces apart to see how the body is organized.
—
KiwiBee uses optional Google Analytics, Google Ads, and Meta Pixel cookies to understand adult visitors, measure completed sign-ups, and improve campaigns. Essential cookies always stay on. OpenAI’s ChatGPT Ads Pixel also measures page views and completed enquiries after advertising consent, and may use hashed contact details for matching. Privacy policy
Chromatography & Rf Lab is a 3D analytical chemistry simulation of paper and thin-layer chromatography (TLC). A cellulose strip spotted with a mixture along its pencil baseline hangs inside a sealed glass developing chamber with its bottom edge dipped in a mobile-phase solvent pool. As capillary action draws the solvent front upward (ds), mixture components partition differently between the polar stationary paper and the rising mobile solvent, separating into distinct coloured bands (dx). Students can switch between Spinach Leaf Pigments, Black Marker Ink, and Food Dyes, tune solvent polarity, click any separated spot, and drag a 3D graduated centimeter ruler next to the chromatogram to verify Rf = dx / ds.
The retention factor (Rf) is calculated by dividing the distance traveled by the center of a solute spot from the baseline origin (dx) by the distance traveled by the solvent front from the same baseline (ds): Rf = dx / ds. Because a spot can never outrun the solvent front, Rf is always between 0 and 1.
Pencil lead is made of insoluble graphite, which stays fixed on the paper when the solvent rises. If the baseline were drawn with a pen, the ink dyes would dissolve in the rising mobile phase and travel up the strip, contaminating the sample chromatogram.
Beta-carotene is a non-polar hydrocarbon with no hydroxyl or carbonyl groups to form hydrogen bonds with the polar cellulose paper, so it spends almost all its time dissolved in the rising organic solvent and moves with an Rf close to 0.9.
If the liquid solvent level in the beaker is higher than the sample spot on the baseline, the pigment mixture will dissolve directly into the pool at the bottom of the tank instead of being carried up the paper strip by capillary action.
Drop it into your LMS, blog, or class site — free.
<iframe src="https://kiwibee.io/en/simulations/paper-tlc-chromatography-3d-3d-simulation/embed" title="Chromatography & Rf Lab | KiwiBee" loading="lazy" allowfullscreen style="width:100%;height:min(70vh,620px);min-height:420px;border:0;border-radius:16px"></iframe>Continue exploring
Explore an adult male reference body in 3D. Reveal 14 anatomical systems, search thousands of named structures, isolate organs, and pull 2,209 modeled pieces apart to see how the body is organized.
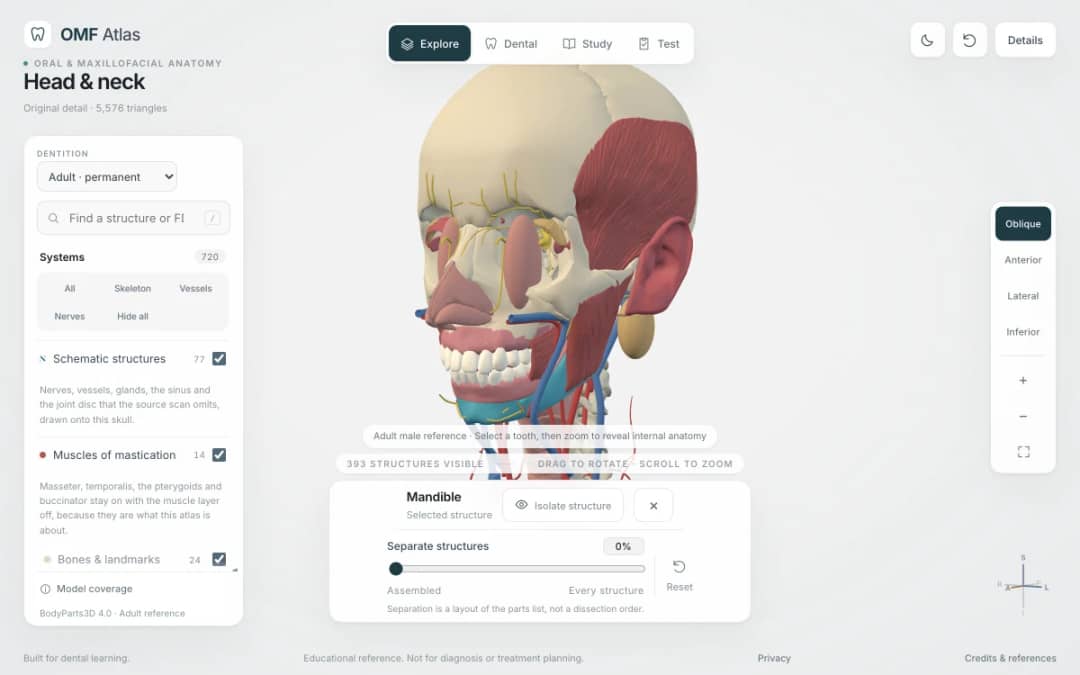
Explore the head and neck in 3D: 643 source meshes across 14 layers, 47 facial and masticatory muscles, and 77 drawn nerves, vessels and glands the source scan omits. Open any tooth onto its own pulp canal, and follow the seven stages of tooth development.

Free interactive photosynthesis simulation. Explore photosynthesis hands-on online — great for whole-class or independent practice.

Free interactive states of matter simulation. Explore states of matter hands-on online — great for whole-class or independent practice.

Free interactive shadows simulation. Explore shadows hands-on online — great for whole-class or independent practice.
KiwiBee's free teacher workspace brings lesson planning, worksheets, classroom tools, and gradebook together in one place.
Start free and create your first class Home
 All solutions
 Pricing
 About us
 KiwiBee for Non-profits
 Events & webinars
 For big organisations
 For schools
 For centers
 For team leaders
 For teachers
 AI and resources
 Resources
 Printable worksheets
 Lesson Packs
 Interactive simulations
 Teacher tools
 AI studio
 Ideas and research