
About this simulation
A fraction says how big a part is compared with a whole: the bottom number is how many equal pieces the whole is cut into, and the top number is how many of them you have. Because it is a size, two fractions can be compared by looking at how far each reaches along the same number line, and two different-looking fractions such as 1/2 and 2/4 can be exactly the same amount, cut into different numbers of pieces. Adding fractions follows from the same idea: pieces of different sizes cannot be counted together, so both fractions are first cut into pieces of one common size (a common denominator), and only then are the tops added. Students can change a: pieces in one whole and a: pieces shaded and compare what happens. Use it for math inquiry with Grades 2–5 and Middle School on a projector or student device.
Standards: Common Core CCSS.MATH.CONTENT.3.NF.A.2, CCSS.MATH.CONTENT.3.NF.A.3, CCSS.MATH.CONTENT.4.NF.A.1, CCSS.MATH.CONTENT.4.NF.A.2, CCSS.MATH.CONTENT.5.NF.A.1
What students can explore
- Make A = 1/2 and B = 2/4 and see why they land on exactly the same spot of the number line
- Pick the equivalent question and slide k up to see 1/2 = 2/4 = 3/6 = 4/8 with the same slice of the whole
- Compare 3/4 and 2/3 and find which is bigger, then check it with the same-size pieces
- Add 1/2 and 1/3 and watch both be cut into sixths before they are added to make 5/6
- Make a sum bigger than 1 and read it as a mixed number
- Switch between bars, pies and the number line and find what stays the same
Learning objectives
- 1Predict how changing a: pieces in one whole will affect the a as a decimal, then test the prediction.
- 2Use evidence from the interactive visual to explain the result.
Questions teachers ask
Is the Fractions Visualizer simulation free?
Yes. Open the Fractions Visualizer simulation in a modern browser with no download or sign-up required.
Is it suitable for Grades 2–5 and Middle School?
The simulation includes learning-level presets spanning Grades 2–5 and Middle School. Choose the level that matches your class, then use it on a projector or student devices.
Embed this simulation
Drop it into your LMS, blog, or class site — free.
<iframe src="https://kiwibee.io/en/simulations/fractions-visualizer-simulation/embed" title="Fractions Visualizer Simulation | KiwiBee" loading="lazy" allowfullscreen style="width:100%;height:min(70vh,620px);min-height:420px;border:0;border-radius:16px"></iframe>Continue exploring
More interactive science models

Spin a spinner, flip a coin or roll a die and watch two sets of bars: the chances the shapes predict, and the results you actually got. Ten spins prove nothing; a few hundred and the two are hard to tell apart.

Type any function and see its shape straight away. Plot up to three at once in three colours to compare them, drag the trace point to read a value off a curve, and see where each one crosses zero.

Move m and watch the line tilt; move b and watch it slide. Or drag the two points on the line and read the equation it writes back. A rise-over-run staircase climbs the line so slope becomes something you can count.

Two bodies under gravity trace an ellipse forever and you can write the formula down. Add a third and no such formula exists. Run the figure-eight orbit, nudge one mass, and watch a stable pattern become unpredictable while the total energy stays put.

Two paths start a hair apart and follow the same three equations. Watch them agree, then part onto opposite wings of the butterfly. Drag the start, spin the shape and pull rho down until chaos stops.
From model to evidence
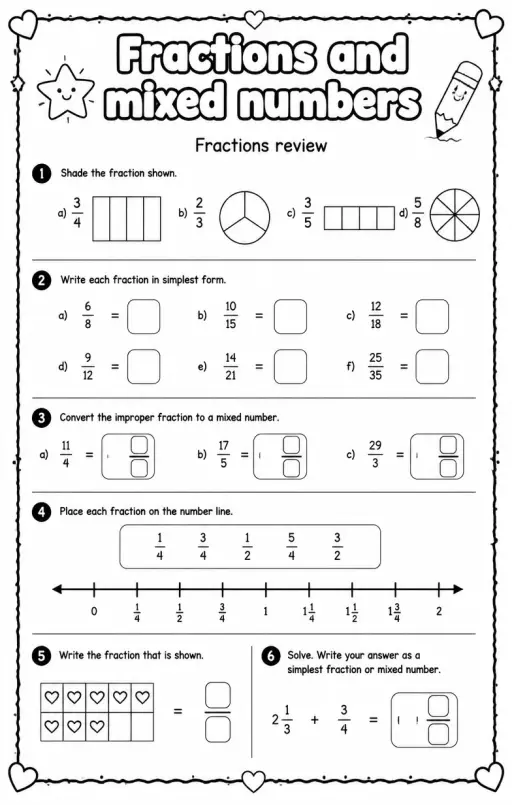
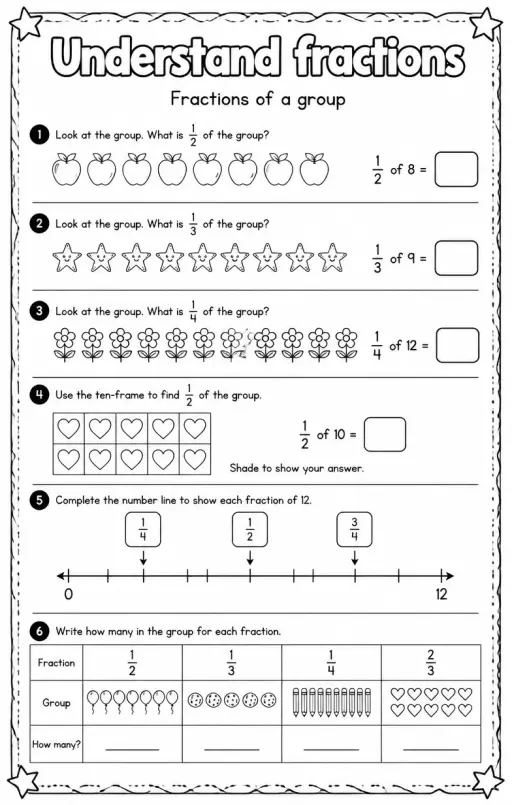
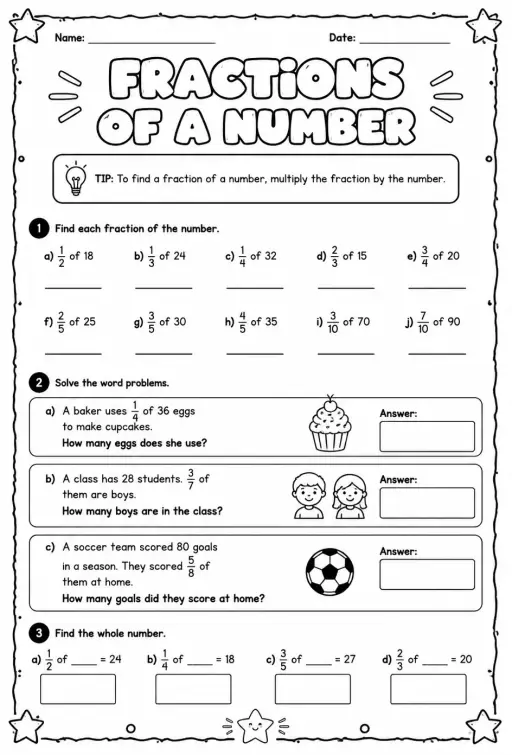
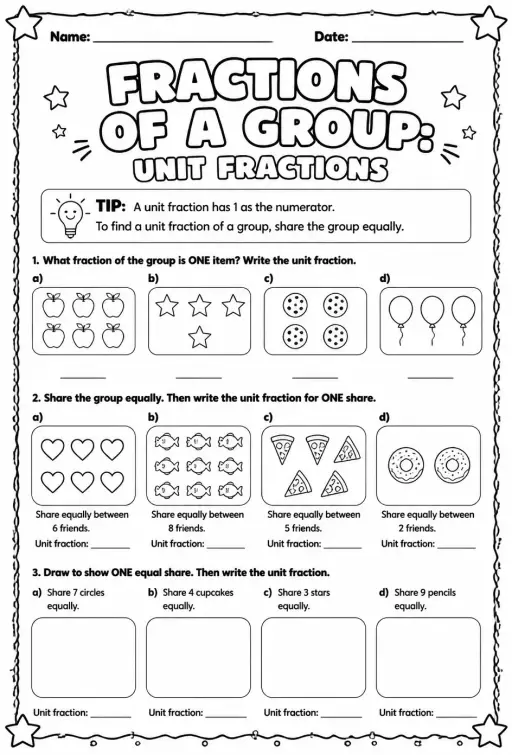
Pair this simulation with a printable
Use a worksheet to capture predictions, observations, and explanations after students explore.


Bring interactive science into your classroom
KiwiBee's free teacher workspace brings lesson planning, worksheets, classroom tools, and gradebook together in one place.
Start free and create your first class For big organisations
 For schools
 For centers
 For team leaders
 For teachers
 AI and resources
 Printable worksheets
 Lesson Packs
 Interactive simulations
 Teacher tools
 AI studio
 Ideas and research