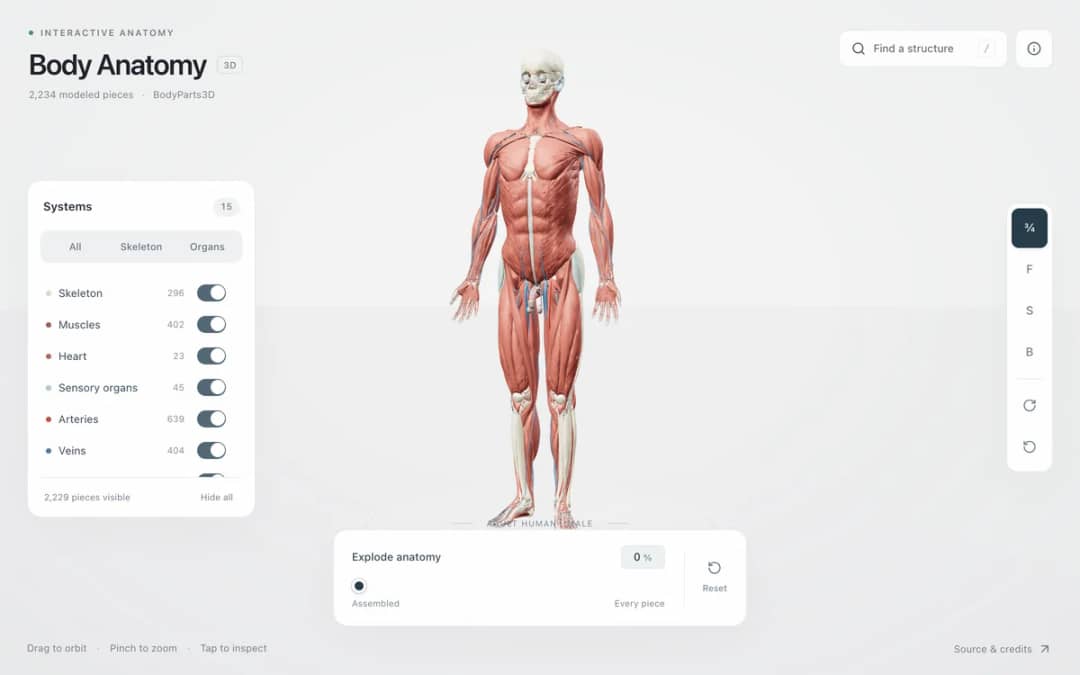
Explore an adult male reference body in 3D. Reveal 14 anatomical systems, search thousands of named structures, isolate organs, and pull 2,209 modeled pieces apart to see how the body is organized.
—
KiwiBee uses optional Google Analytics, Google Ads, and Meta Pixel cookies to understand adult visitors, measure completed sign-ups, and improve campaigns. Essential cookies always stay on. OpenAI’s ChatGPT Ads Pixel also measures page views and completed enquiries after advertising consent, and may use hashed contact details for matching. Privacy policy
Activation Energy Landscape transforms the textbook 2D reaction coordinate diagram into a dynamic 3D potential-energy mountain pass. Reactant spheres in the left valley draw thermal kinetic energies scaled by Temperature and attempt to climb over the transition-state saddle (activated complex) into the product valley on the right. Molecules with kinetic energy below the effective activation energy (Ea) roll back into the reactant valley, whereas energetic molecules surmount the peak and turn golden as products. Students can drag the glowing purple transition-state peak vertically, vary ΔH from strongly exothermic (-60 kJ/mol) to endothermic (+60 kJ/mol), or engage the green Platinum catalyst block to lower the barrier by nearly half and watch the reaction rate surge.
Activation energy (Ea) is the minimum kinetic energy that colliding reactant particles must possess in order to stretch and break existing chemical bonds and reach the high-energy transition state before new product bonds can form.
A catalyst provides an alternative reaction mechanism with a lower-energy transition state. Because the activation energy barrier (Ea) is lower, a much larger fraction of colliding molecules at the same temperature have enough energy to cross the barrier.
No. Enthalpy change (ΔH) depends only on the potential energy difference between the initial reactants and final products, which are state functions. A catalyst lowers the transition-state peak in the middle without changing the height of either valley.
According to the Maxwell-Boltzmann distribution and the Arrhenius equation k = A · exp(-Ea / RT), raising temperature shifts the high-energy tail of the molecular energy distribution, exponentially increasing the fraction of molecules whose energy exceeds Ea.
Drop it into your LMS, blog, or class site — free.
<iframe src="https://kiwibee.io/en/simulations/activation-energy-reaction-profile-3d-simulation/embed" title="Activation Energy Landscape | KiwiBee" loading="lazy" allowfullscreen style="width:100%;height:min(70vh,620px);min-height:420px;border:0;border-radius:16px"></iframe>Continue exploring
Explore an adult male reference body in 3D. Reveal 14 anatomical systems, search thousands of named structures, isolate organs, and pull 2,209 modeled pieces apart to see how the body is organized.
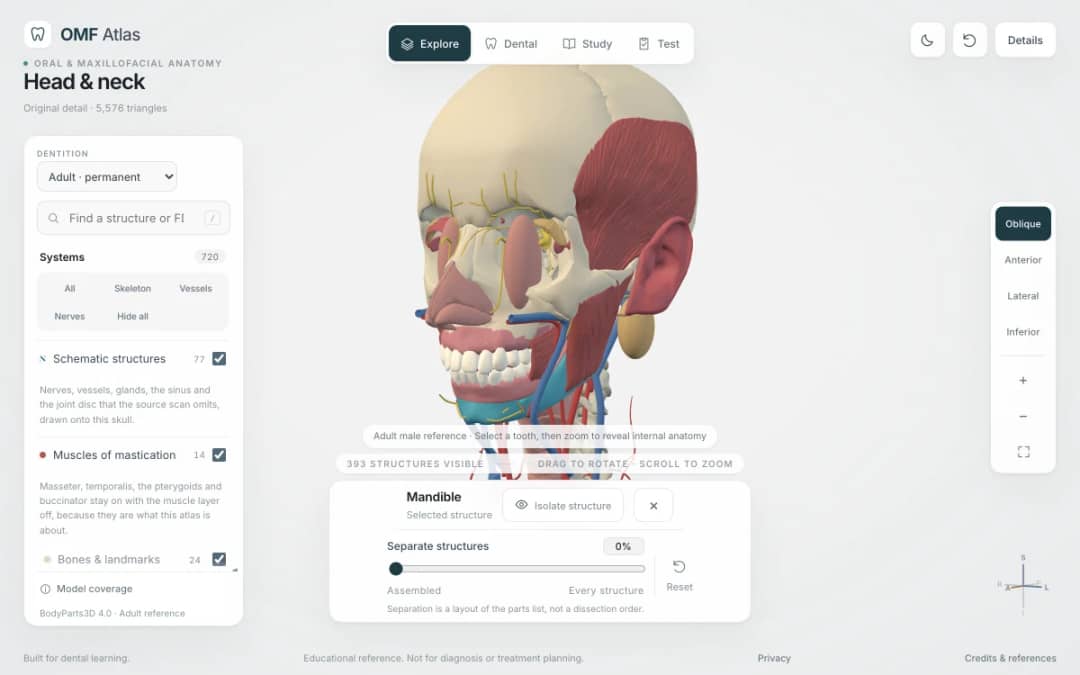
Explore the head and neck in 3D: 643 source meshes across 14 layers, 47 facial and masticatory muscles, and 77 drawn nerves, vessels and glands the source scan omits. Open any tooth onto its own pulp canal, and follow the seven stages of tooth development.

Free interactive photosynthesis simulation. Explore photosynthesis hands-on online — great for whole-class or independent practice.

Free interactive states of matter simulation. Explore states of matter hands-on online — great for whole-class or independent practice.

Free interactive shadows simulation. Explore shadows hands-on online — great for whole-class or independent practice.
From model to evidence
Use a worksheet to capture predictions, observations, and explanations after students explore.
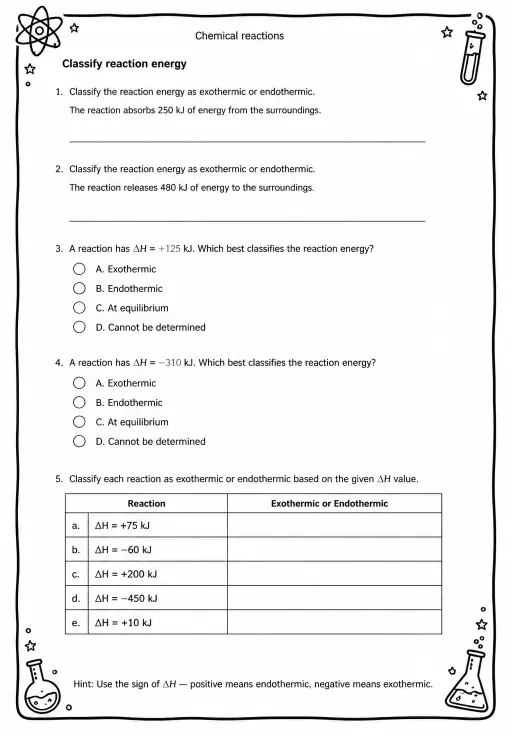
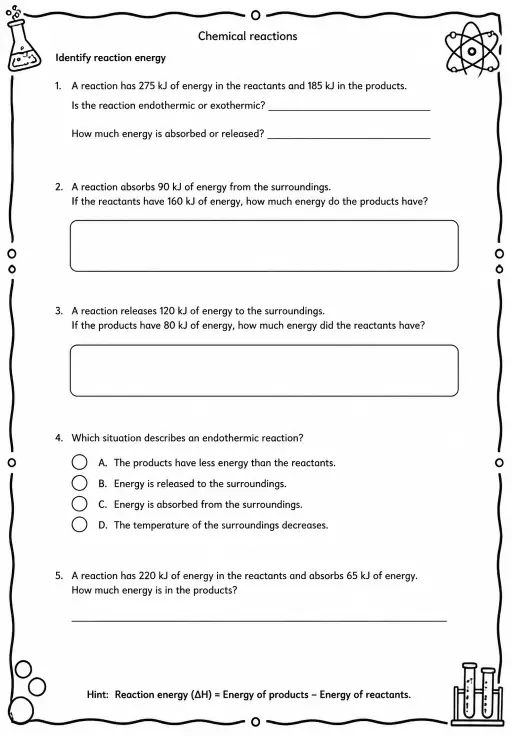
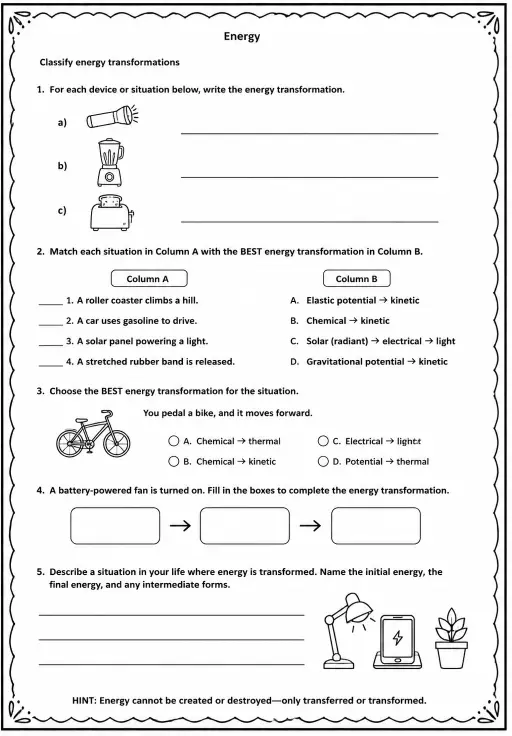
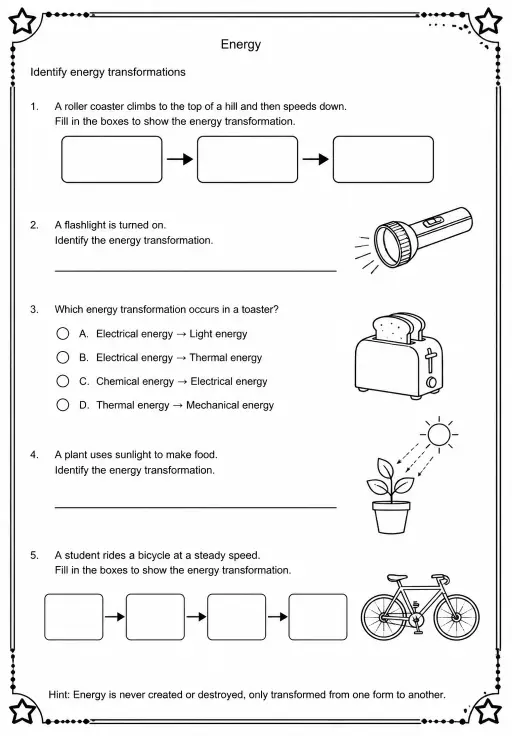
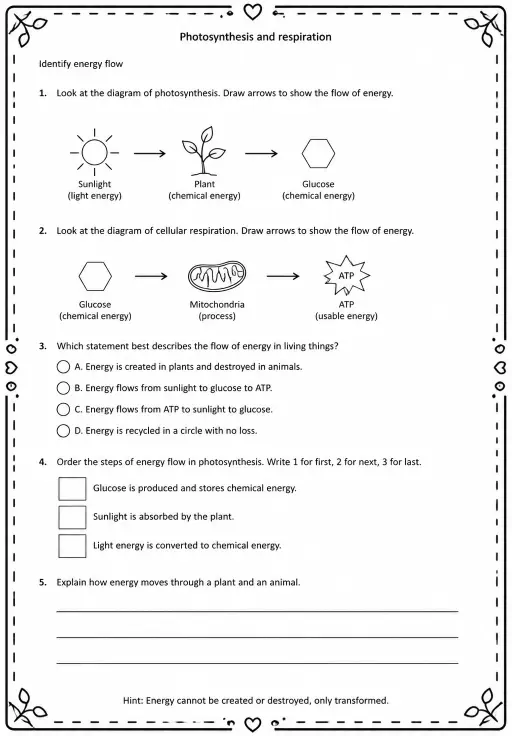
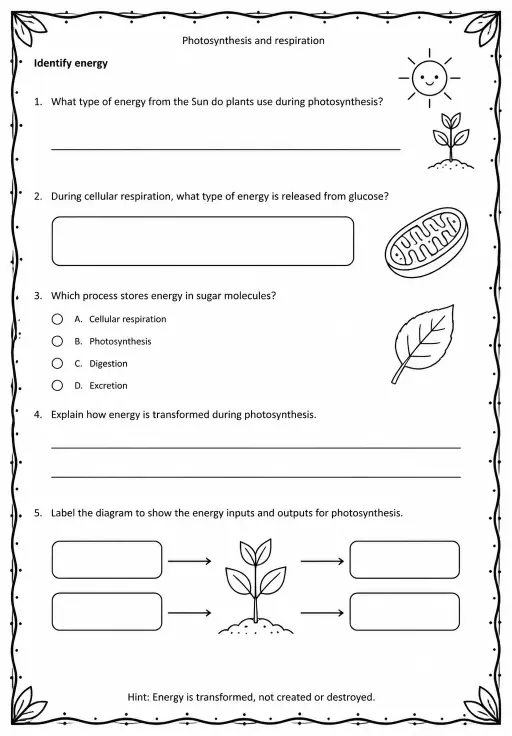
KiwiBee's free teacher workspace brings lesson planning, worksheets, classroom tools, and gradebook together in one place.
Start free and create your first class Home
 All solutions
 Pricing
 About us
 KiwiBee for Non-profits
 Events & webinars
 For big organisations
 For schools
 For centers
 For team leaders
 For teachers
 AI and resources
 Resources
 Printable worksheets
 Lesson Packs
 Interactive simulations
 Teacher tools
 AI studio
 Ideas and research