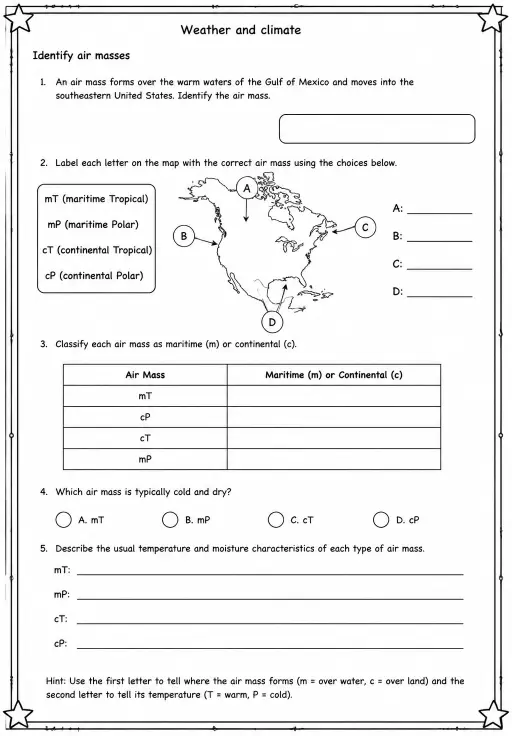
Identify air masses
Worksheets
hard
Ages 11–14
——
KiwiBee uses optional Google Analytics, Google Ads, and Meta Pixel cookies to understand adult visitors, measure completed sign-ups, and improve campaigns. Essential cookies always stay on. OpenAI’s ChatGPT Ads Pixel also measures page views and completed enquiries after advertising consent, and may use hashed contact details for matching. Privacy policy

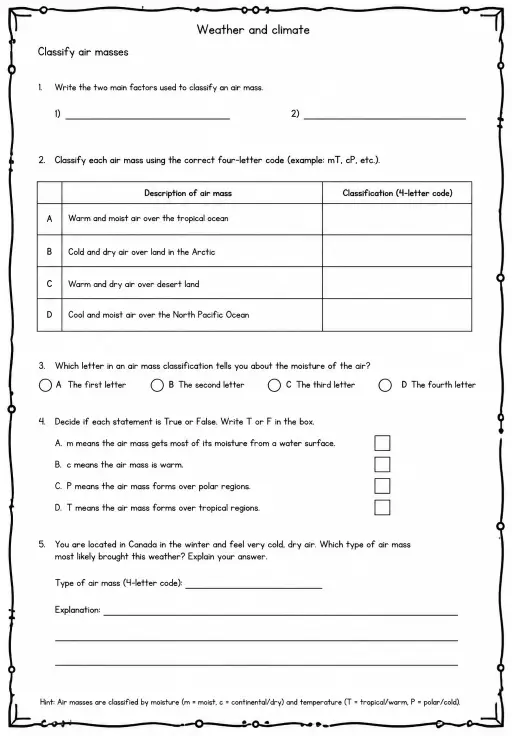
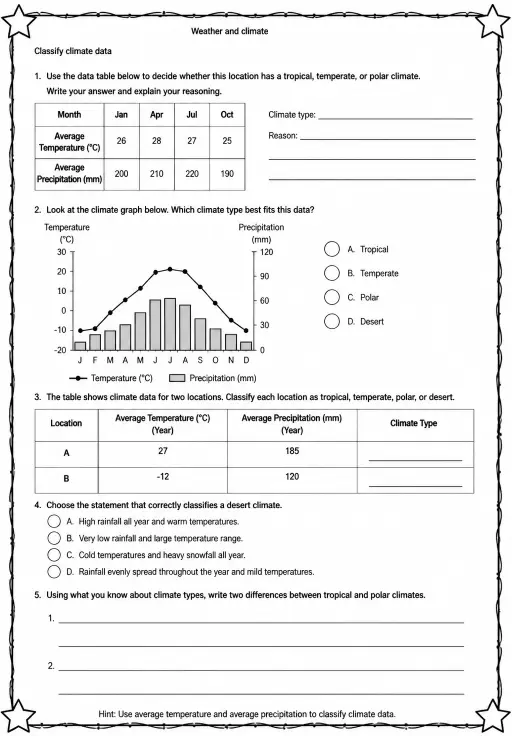
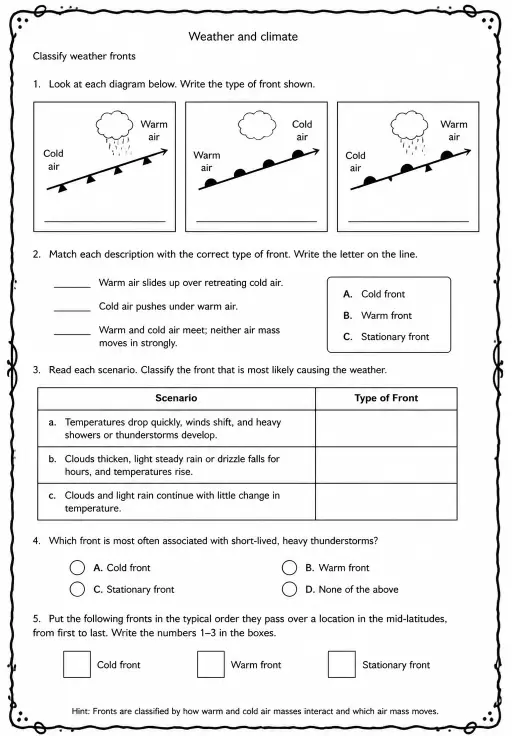
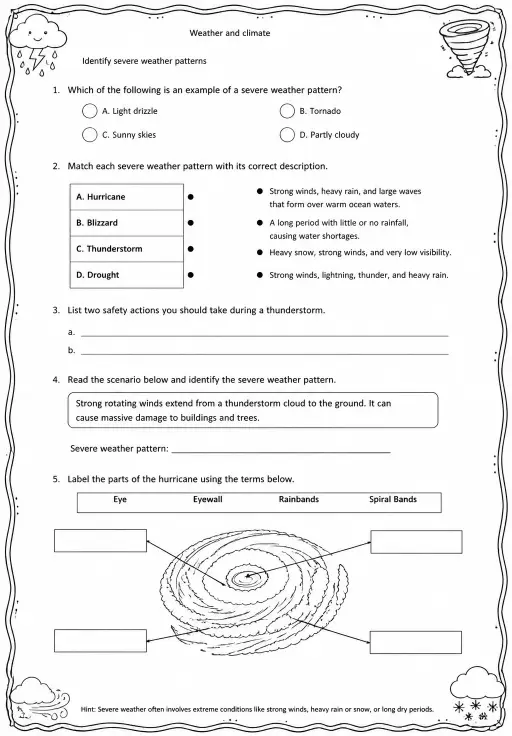
Grades 6–8 students compare observations of severe weather trends and describe the patterns they detect in this challenging Earth and Space Science worksheet, examining data on hurricanes, tornadoes, floods, and other extreme events. Teachers can use it to develop students' data-analysis skills alongside content knowledge, asking them to identify trends, cycles, or geographical concentrations in severe weather occurrence. Pattern recognition in climate data is a core scientific and engineering practice with real-world urgency.
See what other teachers think and share a helpful note.
Generate a fresh worksheet for any grade, topic and language. Free.
 Home
Home All solutions
 Pricing
 About us
 KiwiBee for Non-profits
 Events & webinars
 For big organisations
 For schools
 For centers
 For team leaders
 For teachers
 AI and resources
 Resources
 Printable worksheets
 Lesson Packs
 Interactive simulations
 Teacher tools
 AI studio
 Ideas and research