KiwiBee printable
Rate of change of a linear function: graphs
Free printable Grade 8 math worksheet for "Rate of change of a linear function: graphs" — practice linear functions. No-prep, print or assign online.
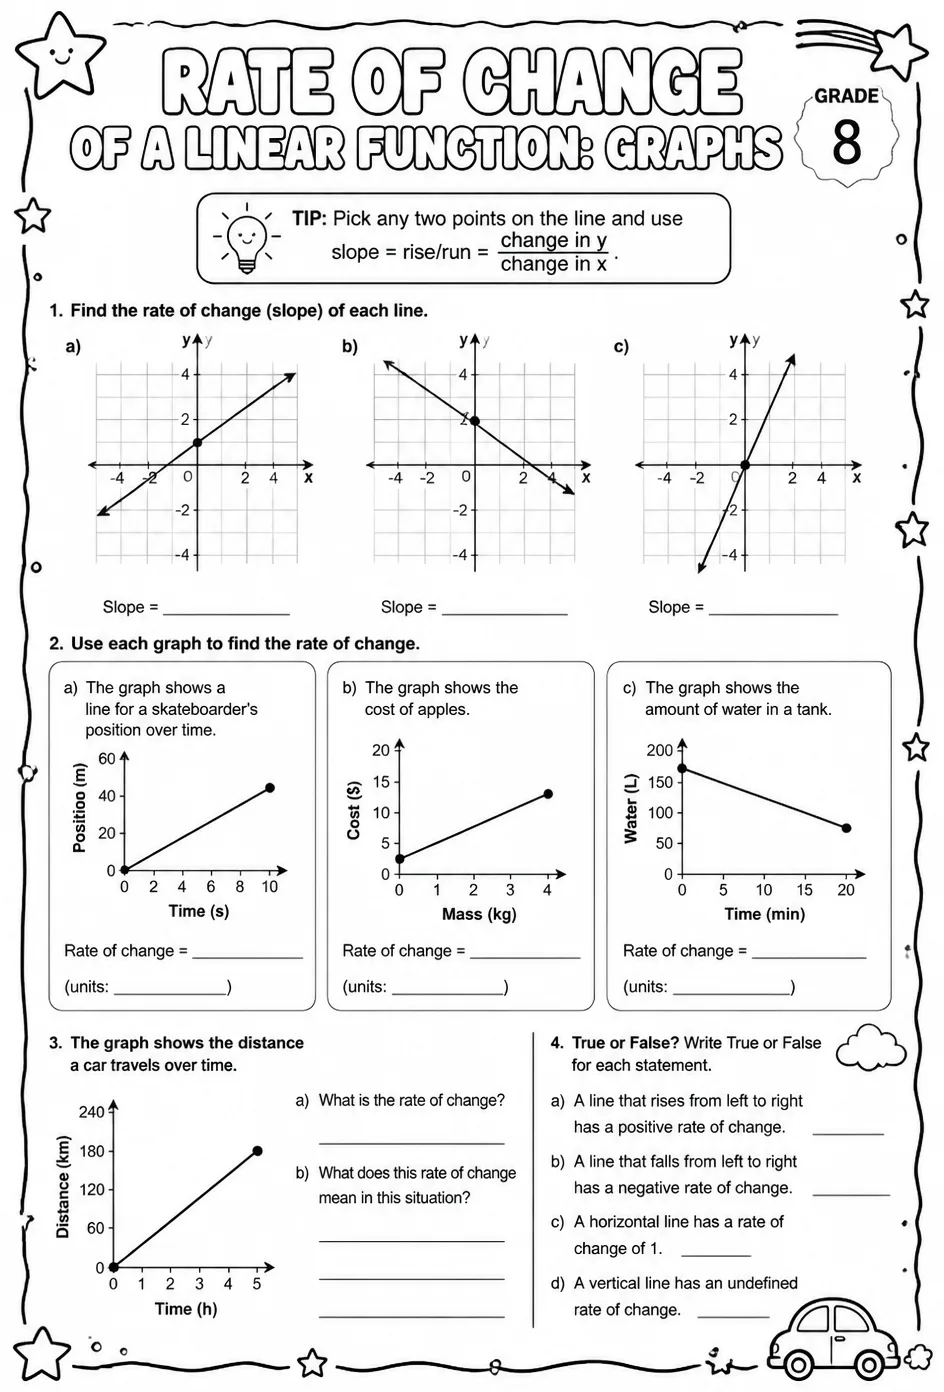
This worksheet helps students master identifying and calculating the rate of change from linear function graphs. Teachers can use it to reinforce understanding of slope as a measure of change between variables. Ideal for middle school math classes focusing on linear functions and graph interpretation.
Learning objectives
- Interpret the rate of change from the graph of a linear function.
- Calculate the rate of change given a linear graph.
- Analyze how changes in the graph affect the slope and rate of change.
How to use this worksheet
- Click “Download Worksheet” and sign in with Google or email to get the PDF instantly.
- Print at home or in class for Middle School; it's no-prep, with no extra materials needed.
- Hand it out as classwork, homework, or a quick warm-up.
Likes & comments
See what other teachers think and share a helpful note.
Loading likes and comments…
Create more worksheets in our Worksheet Studio
Generate fresh worksheets for any grade, topic, and language — free.
Open the Worksheet StudioRelated worksheets
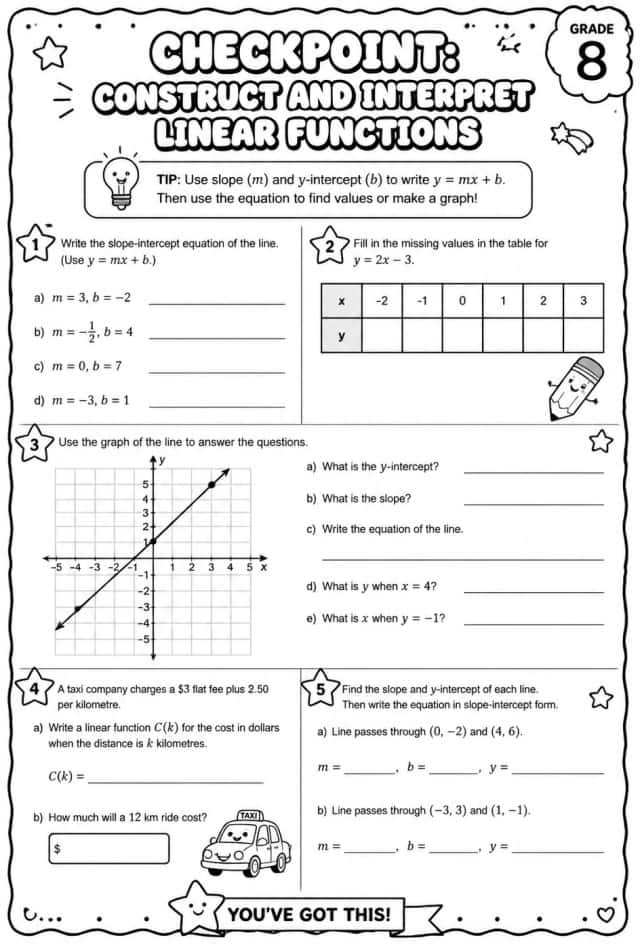
Checkpoint: Construct and interpret linear functions
Worksheets
hard
Ages 11–14
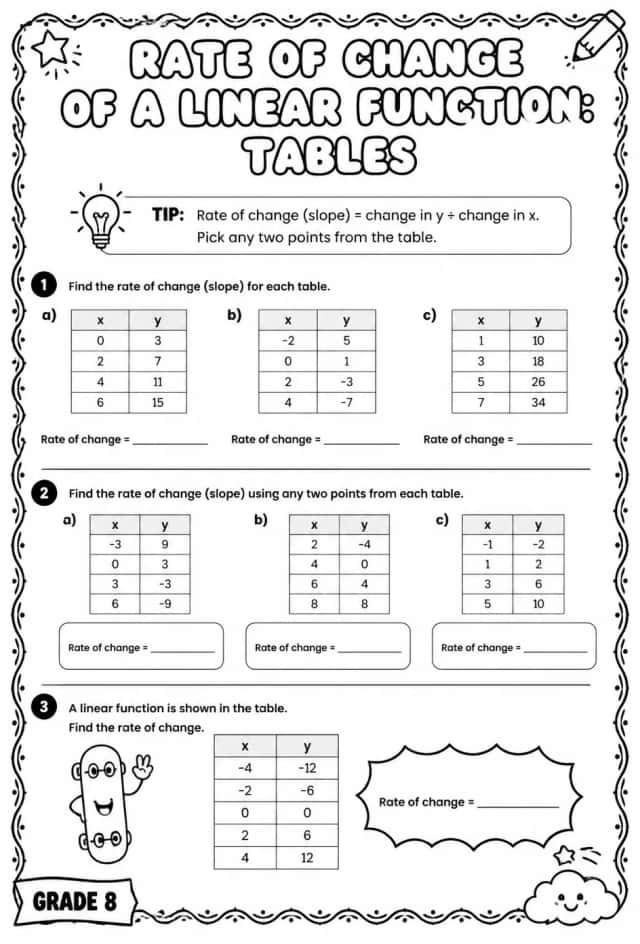
Rate of change of a linear function: tables
Worksheets
hard
Ages 11–14
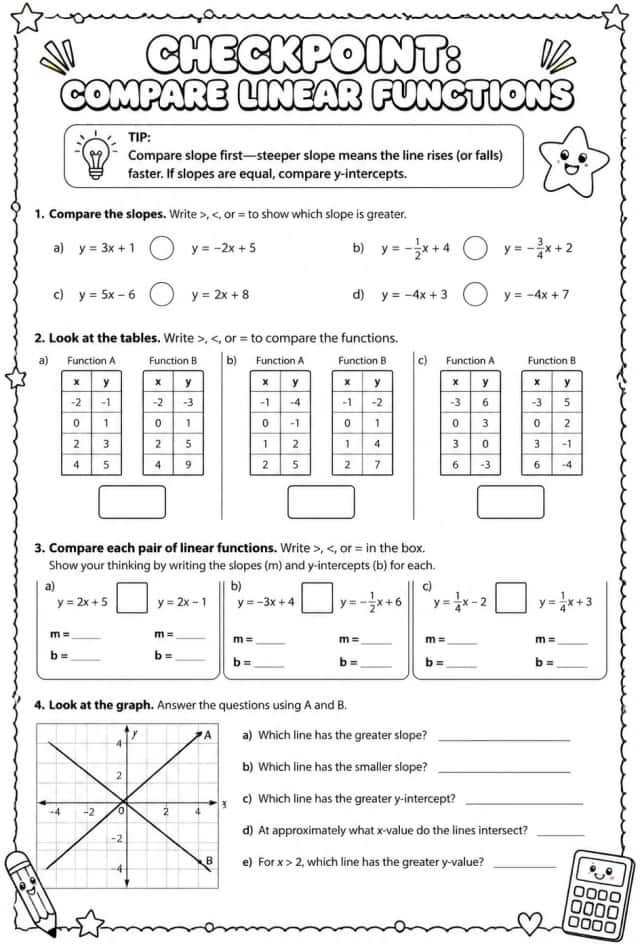
Checkpoint: Compare linear functions
Worksheets
hard
Ages 11–14
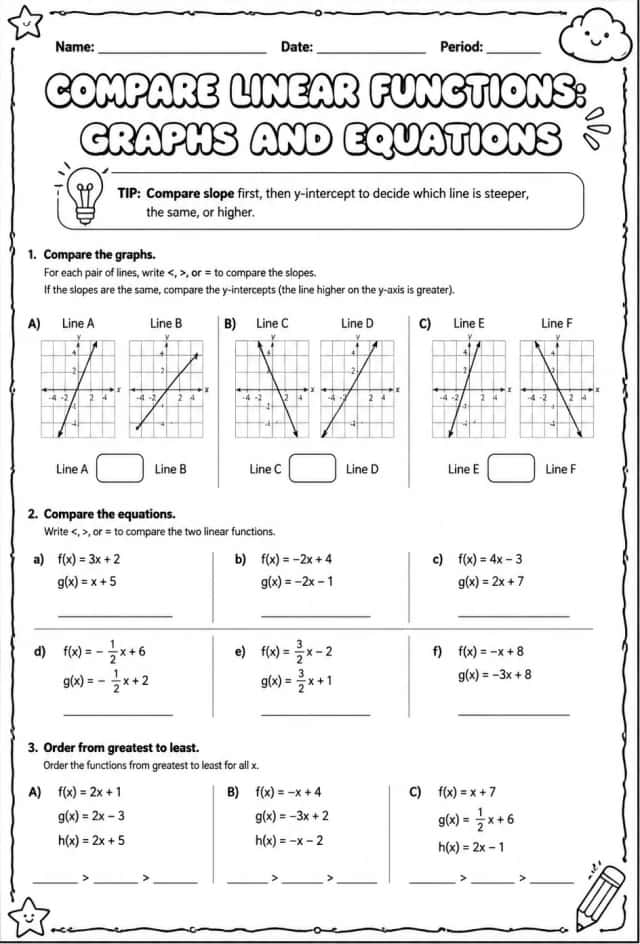
Compare linear functions: graphs and equations
Worksheets
hard
Ages 11–14
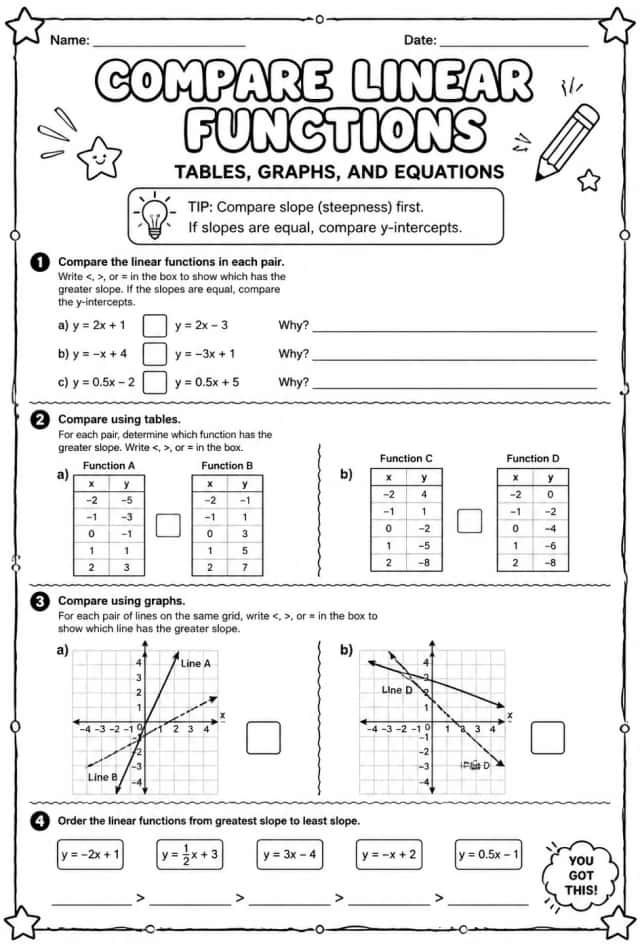
Compare linear functions: tables, graphs, and equations
Worksheets
hard
Ages 11–14
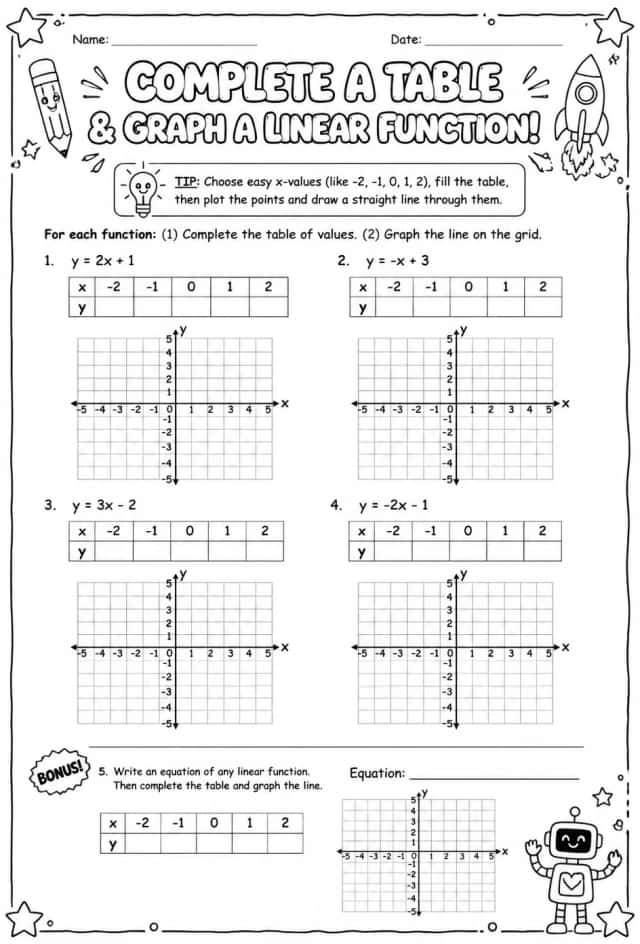
Complete a table and graph a linear function
Worksheets
hard
Ages 11–14
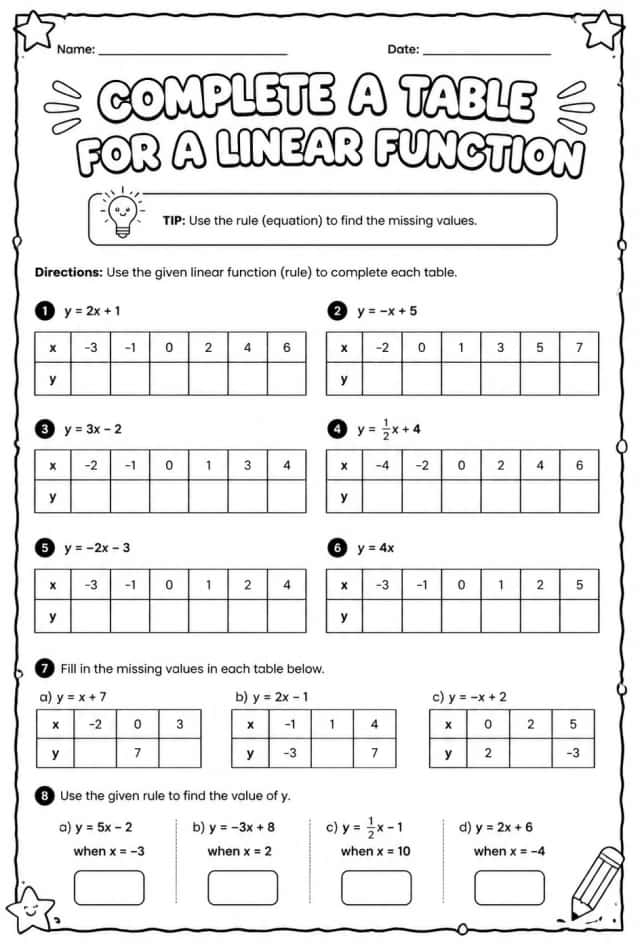
Complete a table for a linear function
Worksheets
hard
Ages 11–14
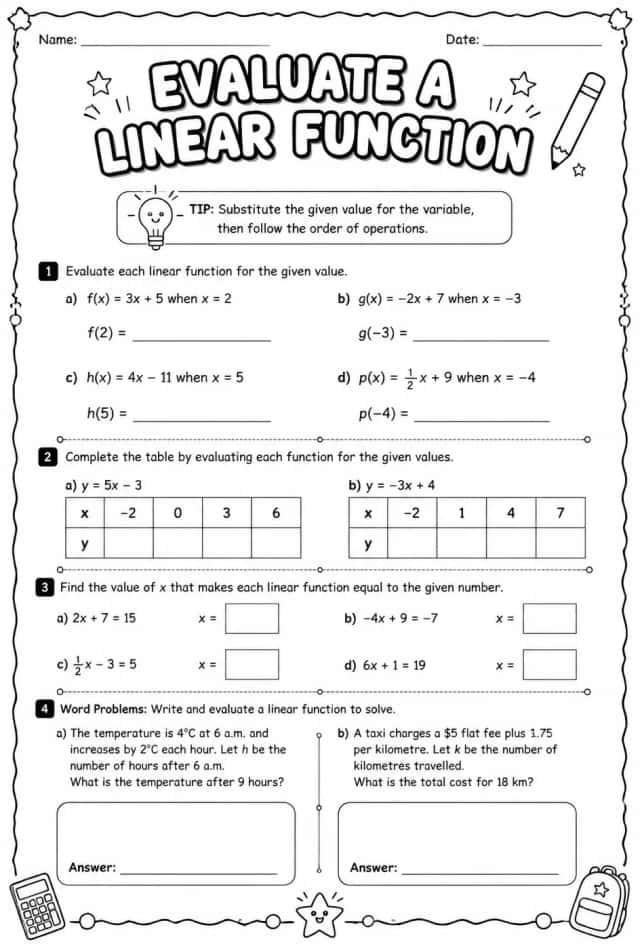
Evaluate a linear function
Worksheets
hard
Ages 11–14