KiwiBee printable
Rate of change of a linear function: tables
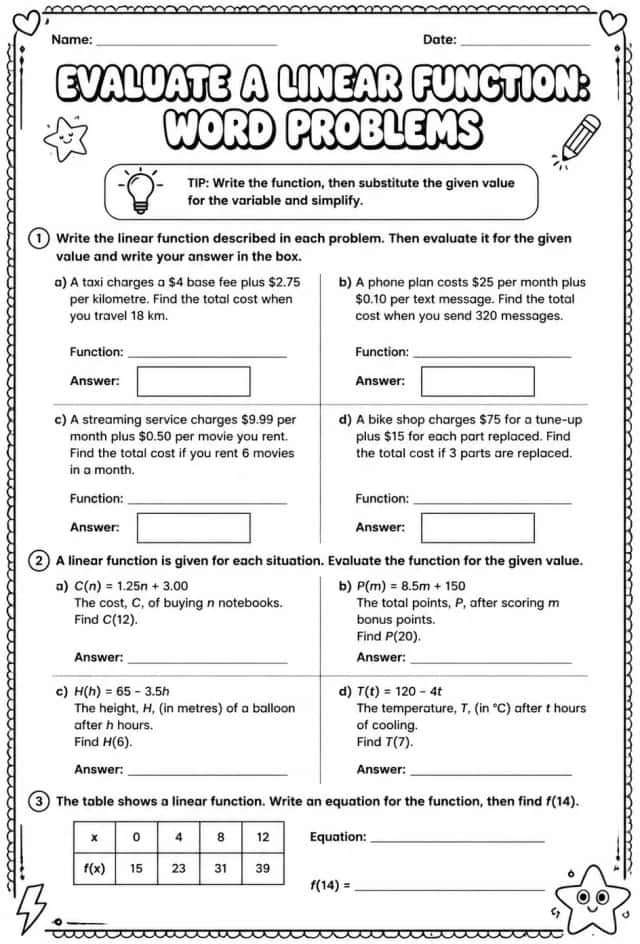
Free printable Grade 8 math worksheet for "Rate of change of a linear function: tables" — practice linear functions. No-prep, print or assign online.
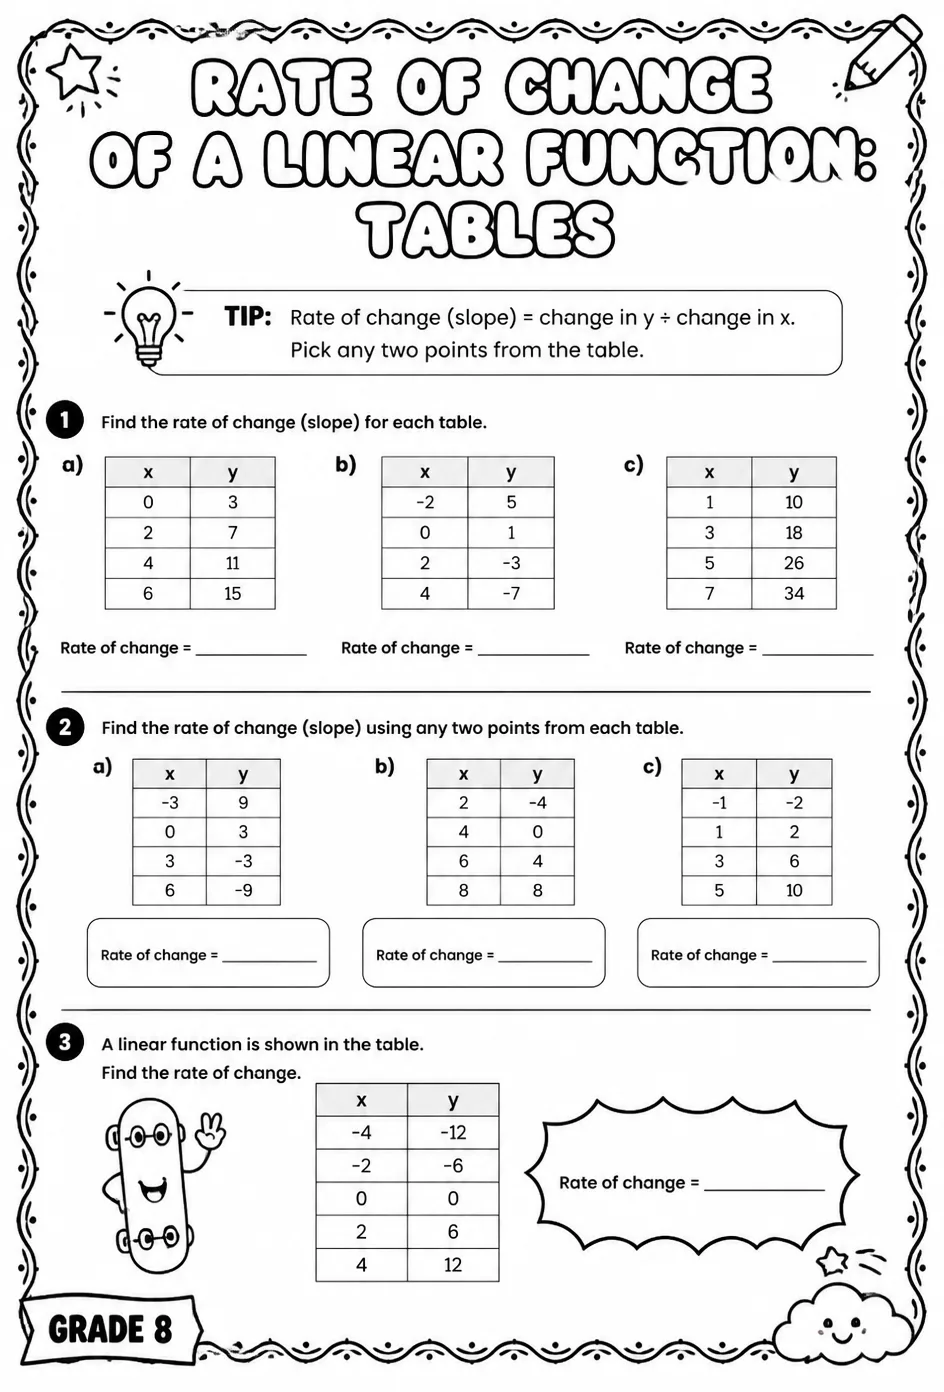
This worksheet focuses on understanding the rate of change in linear functions through tables. Teachers can use it to help students practice extracting and calculating rates of change from tabular data, reinforcing key concepts in linear relationships. It is ideal for middle school classrooms aiming to deepen students’ skills in interpreting linear function data and preparing for algebraic applications.
Learning objectives
- Analyze tables to identify the rate of change in linear functions
- Calculate the rate of change from given data points in tables
- Interpret the meaning of the rate of change in real-world contexts
How to use this worksheet
- Click “Download Worksheet” and sign in with Google or email to get the PDF instantly.
- Print at home or in class for Middle School; it's no-prep, with no extra materials needed.
- Hand it out as classwork, homework, or a quick warm-up.
Likes & comments
See what other teachers think and share a helpful note.
Loading likes and comments…
Create more worksheets in our Worksheet Studio
Generate fresh worksheets for any grade, topic, and language — free.
Open the Worksheet StudioRelated worksheets
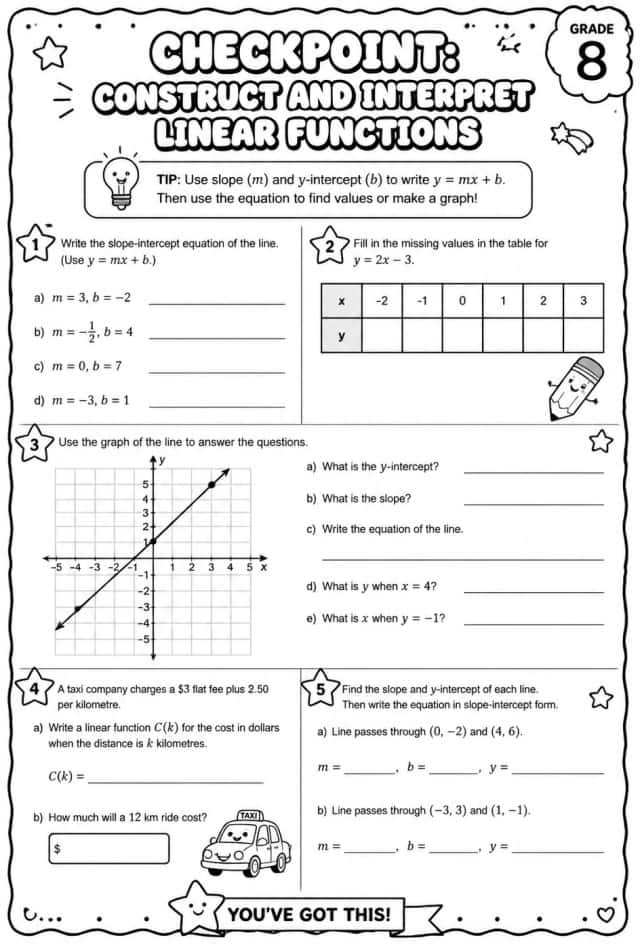
Checkpoint: Construct and interpret linear functions
Worksheets
hard
Ages 11–14
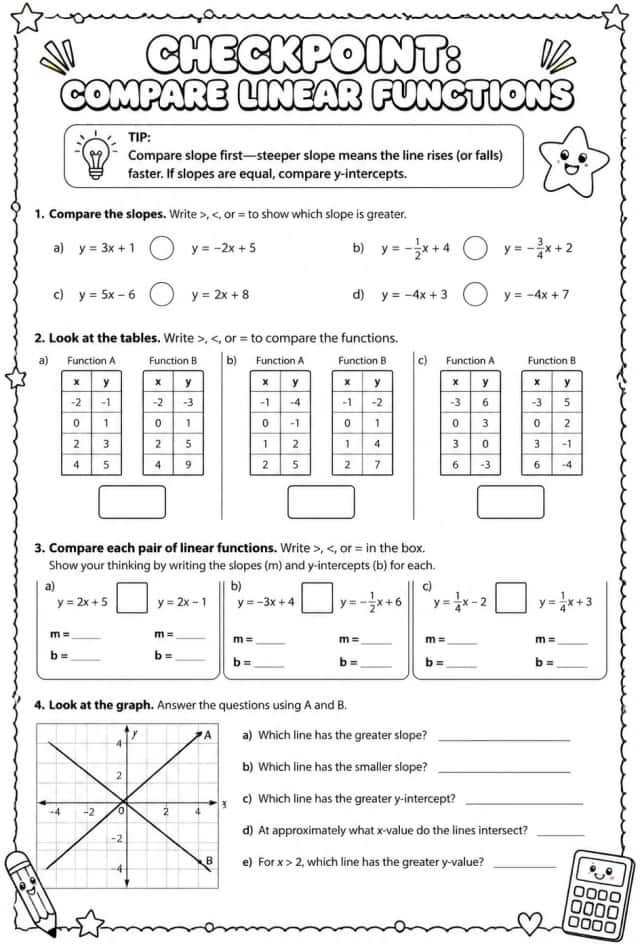
Checkpoint: Compare linear functions
Worksheets
hard
Ages 11–14
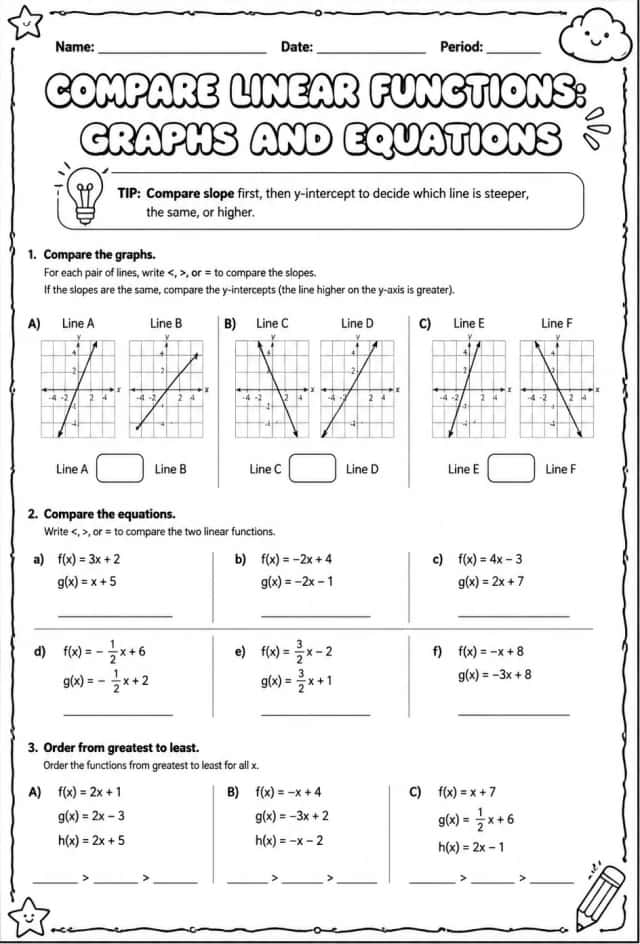
Compare linear functions: graphs and equations
Worksheets
hard
Ages 11–14
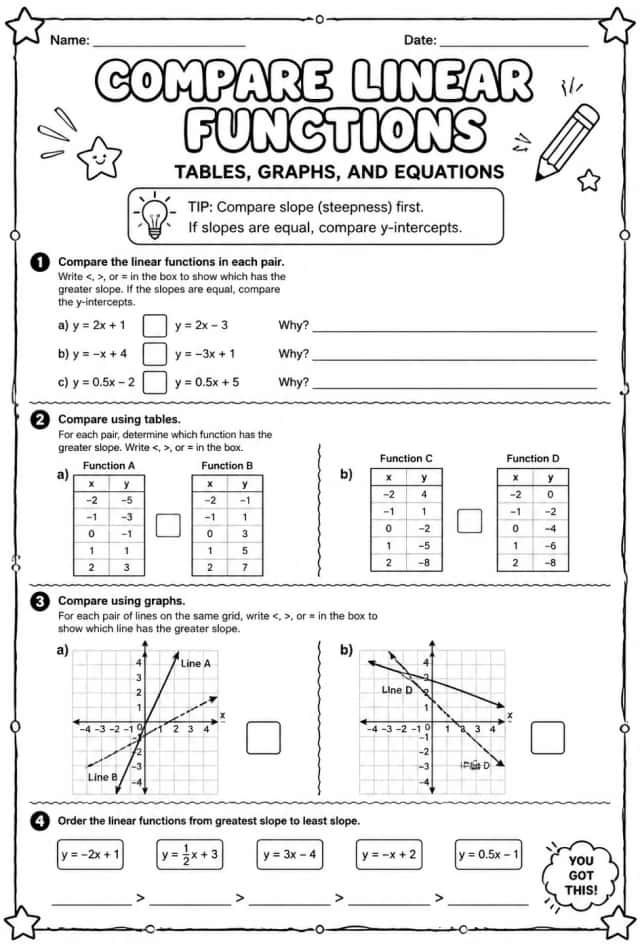
Compare linear functions: tables, graphs, and equations
Worksheets
hard
Ages 11–14
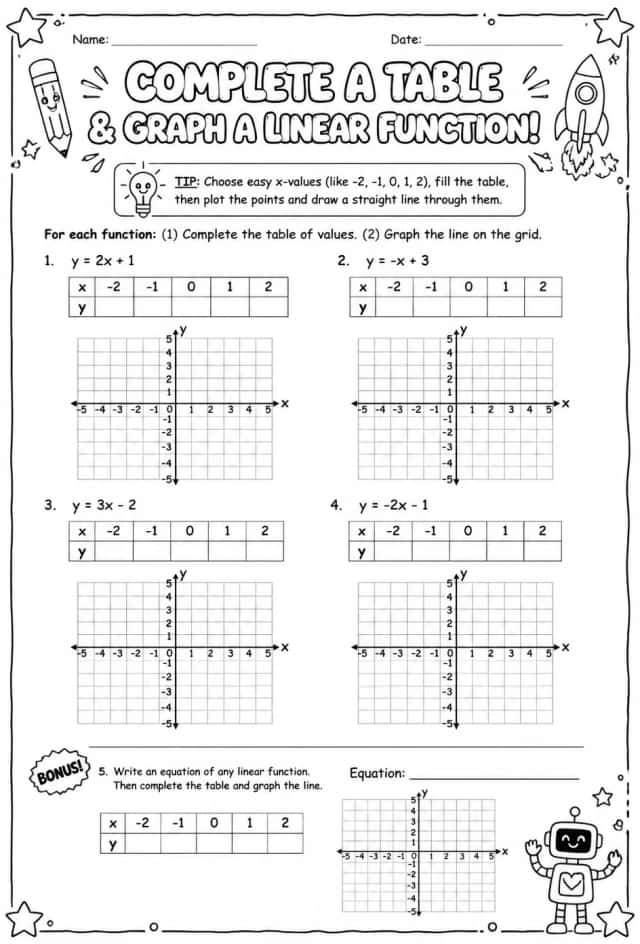
Complete a table and graph a linear function
Worksheets
hard
Ages 11–14
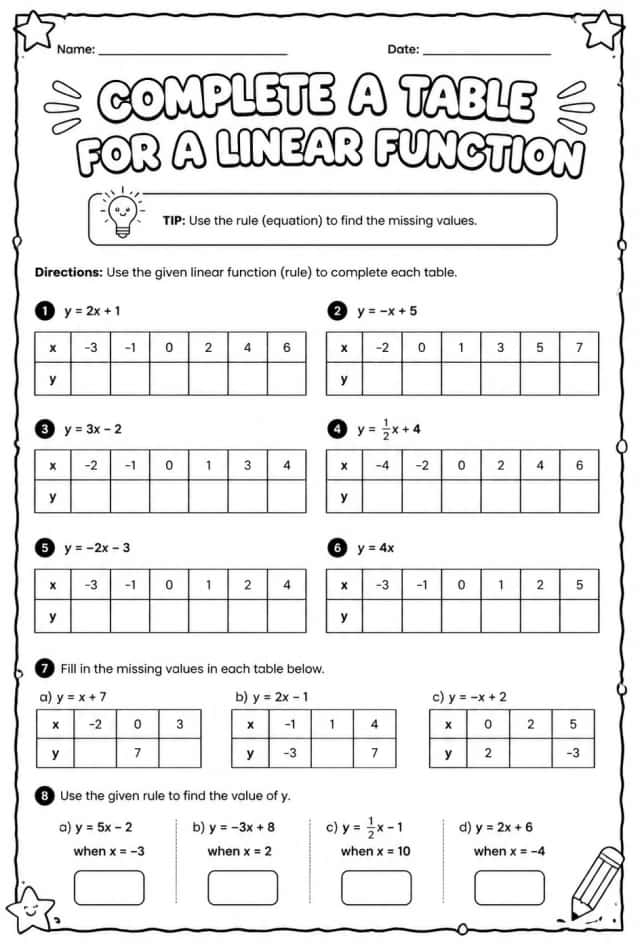
Complete a table for a linear function
Worksheets
hard
Ages 11–14
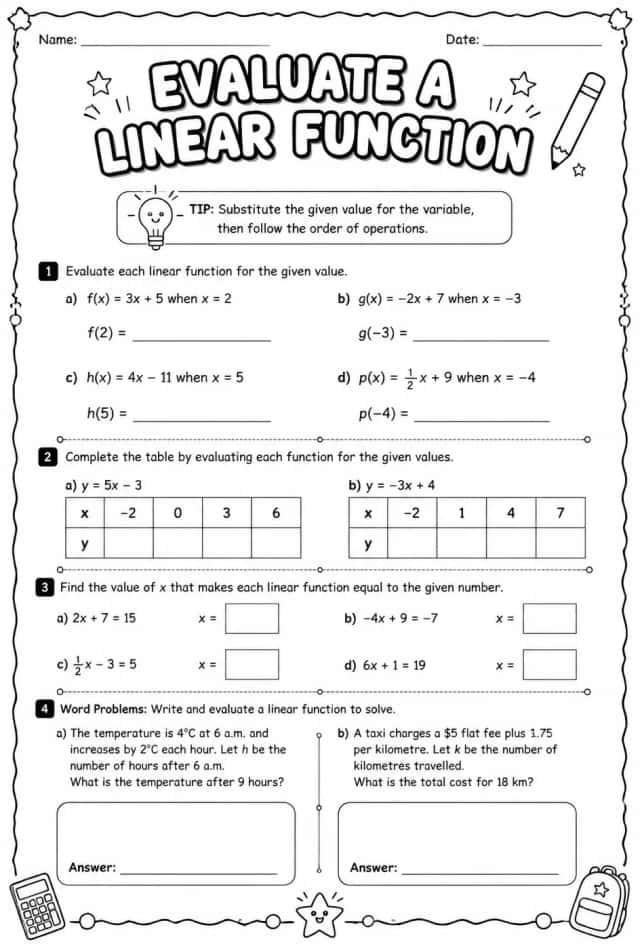
Evaluate a linear function
Worksheets
hard
Ages 11–14
Evaluate a linear function: word problems
Worksheets
hard
Ages 11–14