MathHigh School
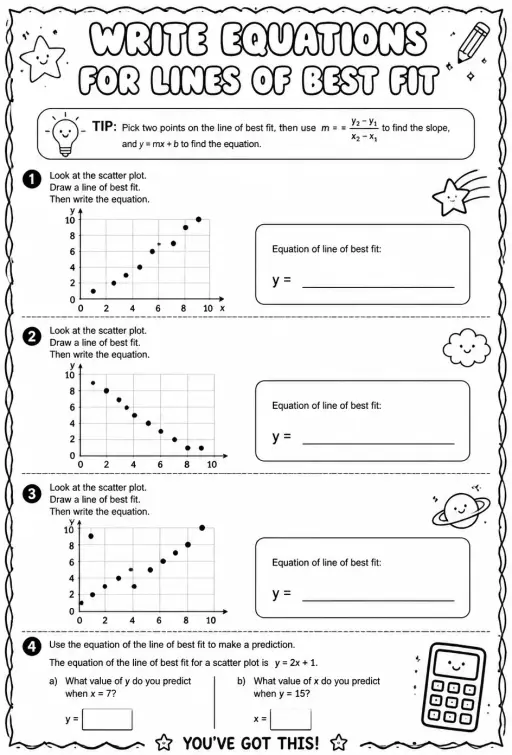
Write equations for lines of best fit
Free printable Algebra 1 math worksheet for "Write equations for lines of best fit" — practice bivariate statistics. No-prep, print or assign online.
——
KiwiBee uses optional Google Analytics, Google Ads, and Meta Pixel cookies to understand adult visitors, measure completed sign-ups, and improve campaigns. Essential cookies always stay on. OpenAI’s ChatGPT Ads Pixel also measures page views and completed enquiries after advertising consent, and may use hashed contact details for matching. Privacy policy

Picked by meaning from games, worksheets, simulations, teacher tools and videos.
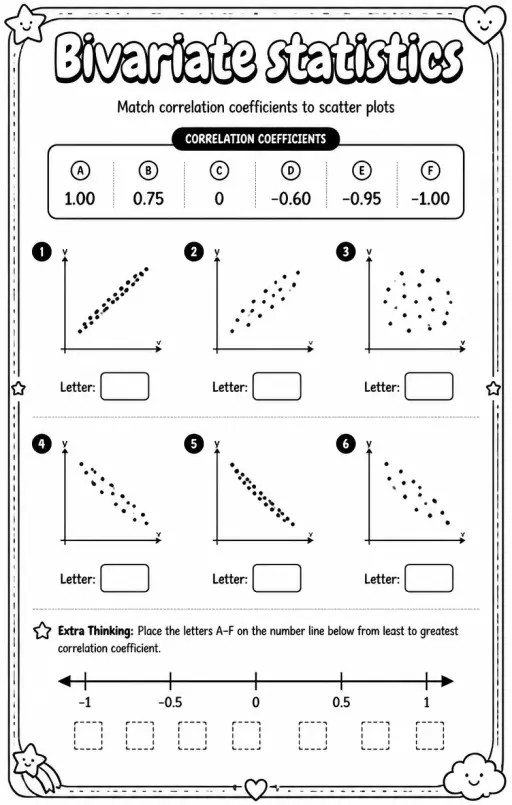 WorksheetMatch Correlation Coefficients to Six Scatter Plots and Order Them
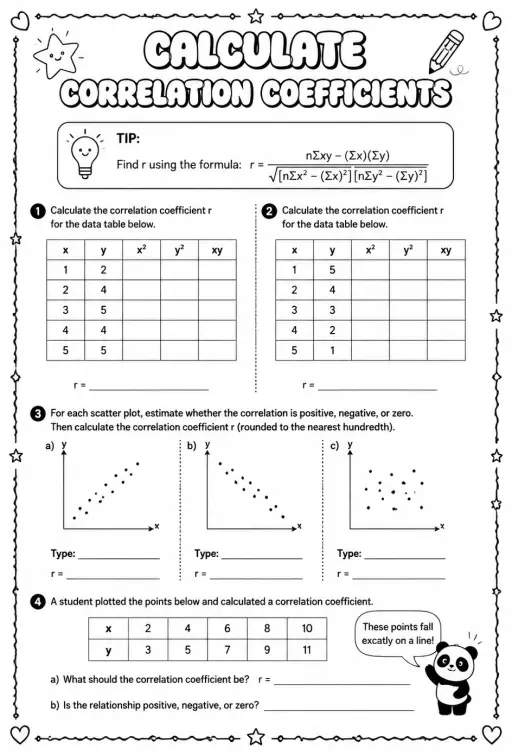 WorksheetCalculate Correlation Coefficients: Formula Tables and Scatter Plots
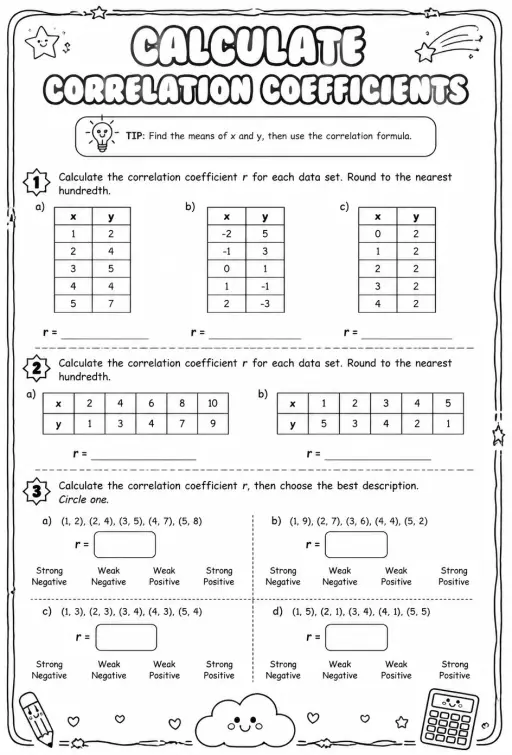 WorksheetCalculate Correlation Coefficients: Data Sets and Descriptions
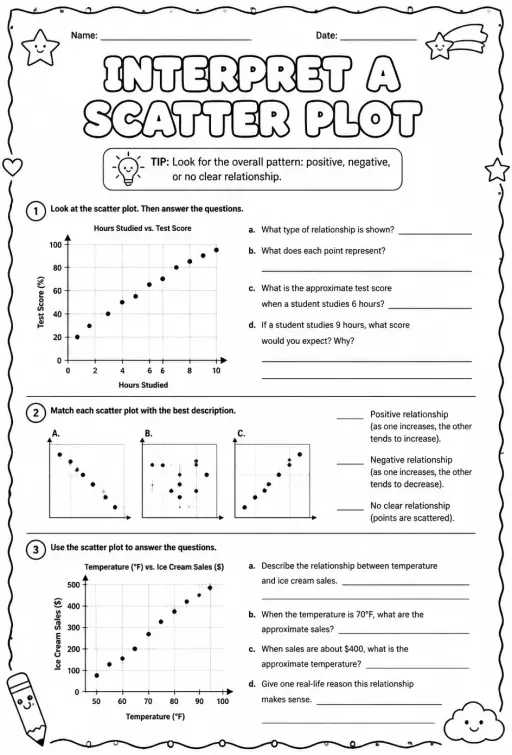 WorksheetInterpret a scatter plot
 GameCorrelation and Causation Quiz
 GameChoosing a Statistical Model
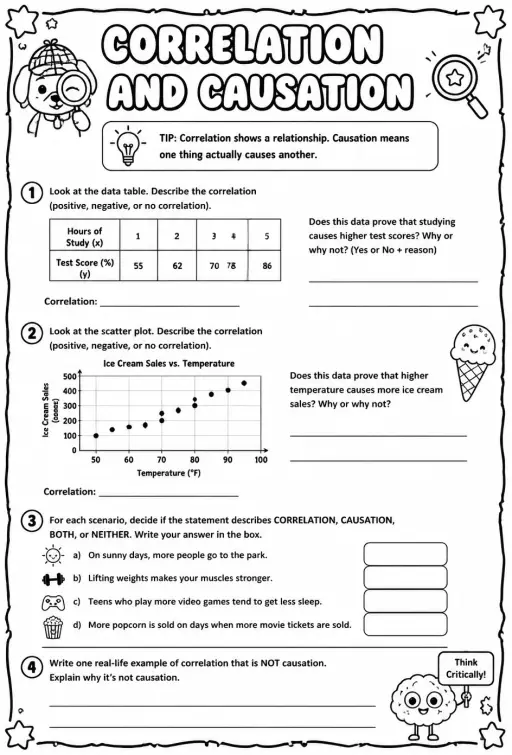 WorksheetCorrelation and causation
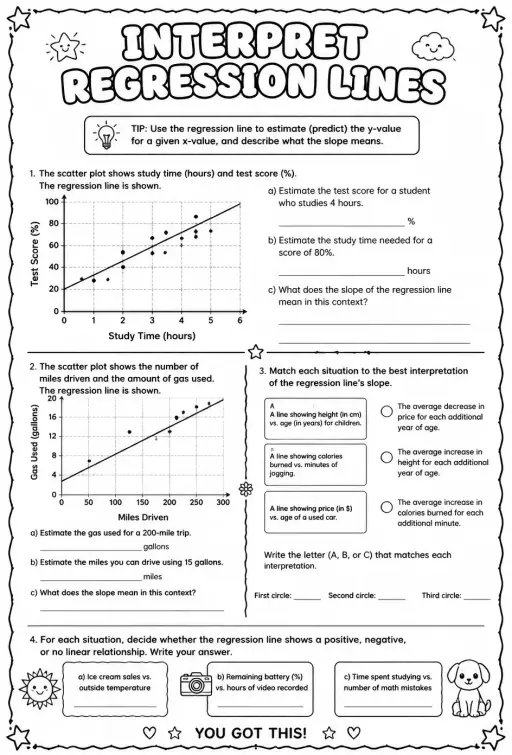 WorksheetInterpret regression lines
This Algebra 1 sheet has three sections and 17 questions. Students match scatter plots A to G to a bank of seven coefficients, estimate a coefficient for plots A to E, and write a fitting coefficient for five descriptions of strength and direction. A tip explains that the sign gives direction and closeness to 1 or -1 gives strength.
Learning objectives © UCLES (Cambridge University Press & Assessment), quoted with attribution.
Skill lists aligned to IXL Learning skill plans, carried over from KiwiBee's System presets; the Maths section names are KiwiBee's own. IXL is a trademark of IXL Learning; no endorsement is implied.
Free printable Algebra 1 math worksheet for "Write equations for lines of best fit" — practice bivariate statistics. No-prep, print or assign online.
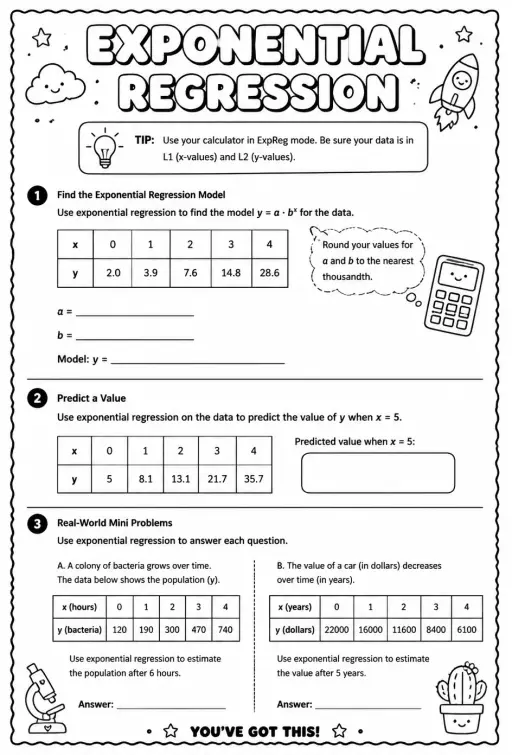
Students use a calculator in ExpReg mode to find a and b for y = a · b^x from a table, predict y when x = 5, then estimate a bacteria population after 6 hours and a car's value after 5 years.
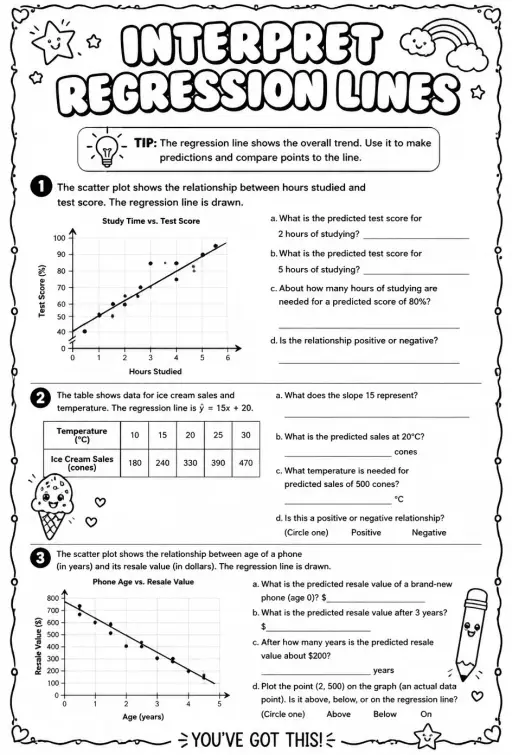
Students read three regression situations: hours studied and test score, ice cream sales against temperature with ŷ = 15x + 20, and phone age against resale value. They predict values and say if each relationship is positive or negative.
See what other teachers think and share a helpful note.
Generate a fresh worksheet for any grade, topic and language. Free.
 Home
 All solutions
 Pricing
 About us
 KiwiBee for Non-profits
 Events & webinars
 For big organisations
 For schools
 For centers
 For team leaders
 For teachers
 Resources
 Printable worksheets
 Interactive simulations
 Teacher tools
 Ideas and research


