KiwiBee printable
Interpret a scatter plot
Free printable Algebra 1 math worksheet for "Interpret a scatter plot" — practice bivariate statistics. No-prep, print or assign online.
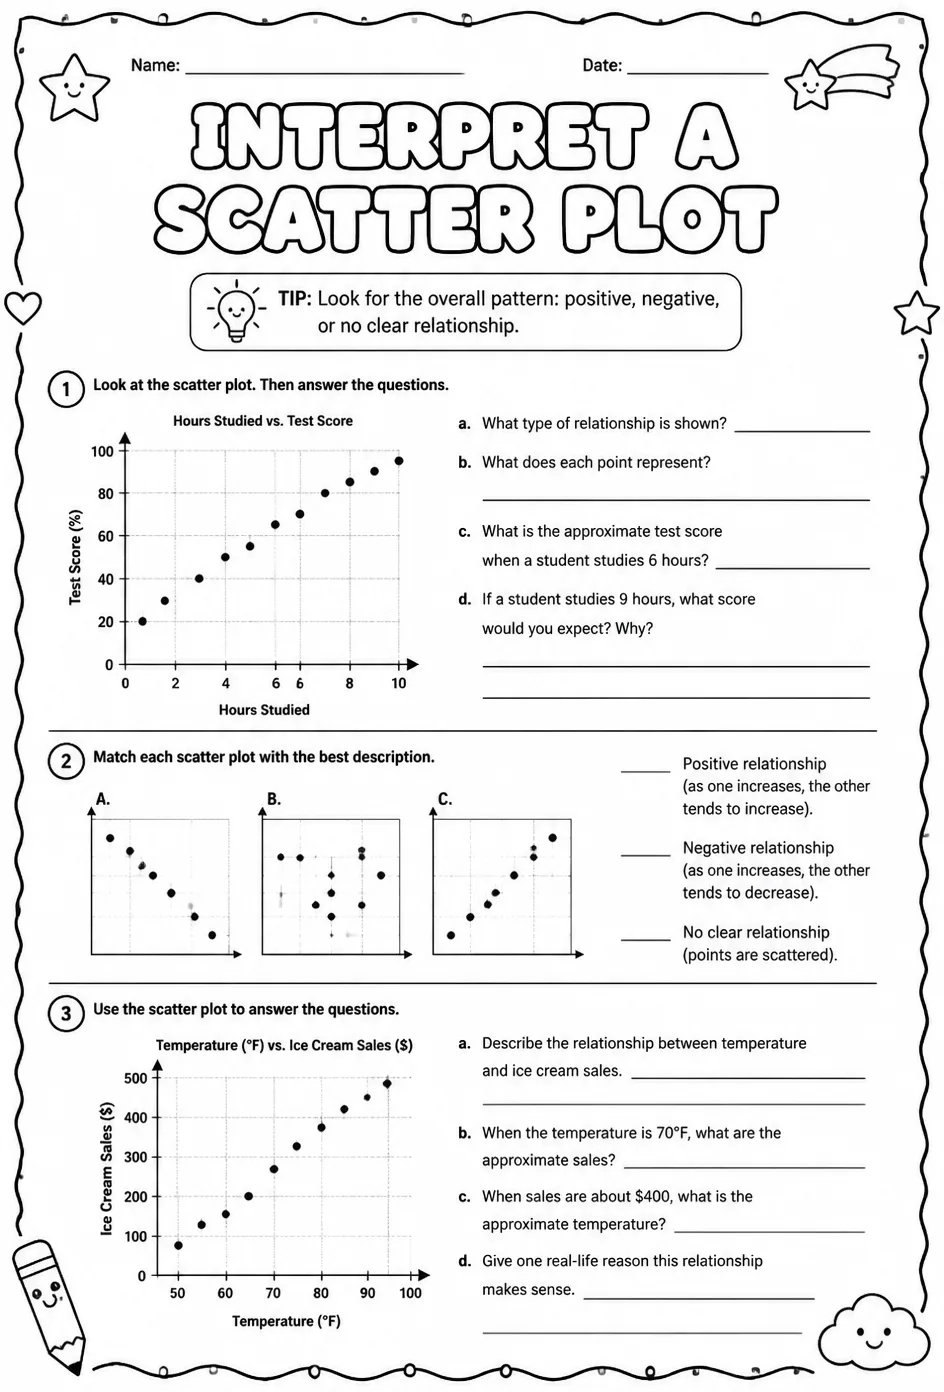
This worksheet provides challenging scatter plot interpretation exercises designed for Algebra 1 students. Teachers can use it to reinforce understanding of bivariate statistics by having students analyze data points, recognize correlation types, and draw conclusions from graphical representations. Ideal for developing critical thinking skills in data analysis and enhancing proficiency in interpreting statistical graphs.
Learning objectives
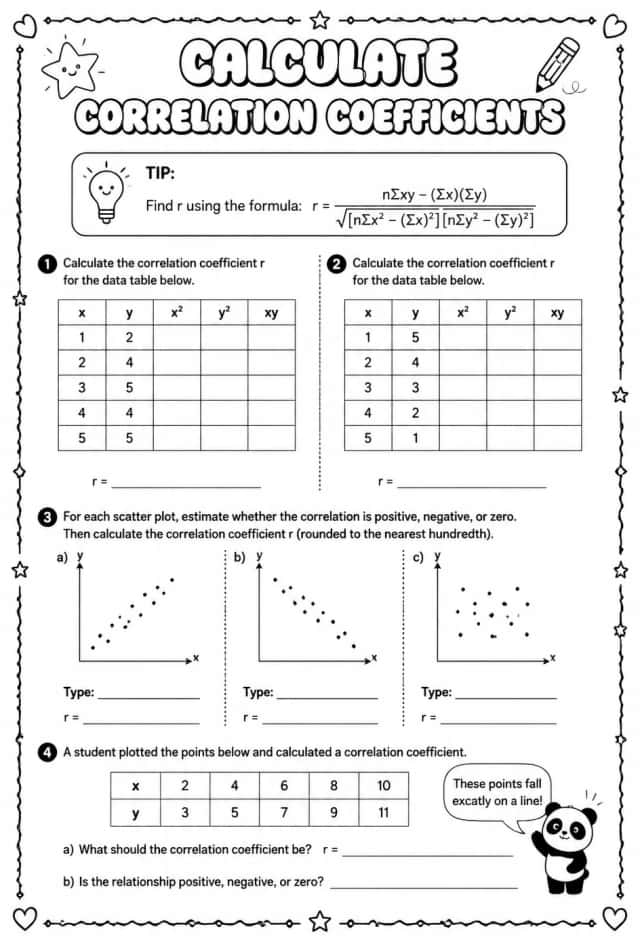
- Analyze the relationship between two variables using a scatter plot
- Identify patterns, trends, and outliers in bivariate data
- Interpret the strength and direction of correlations shown in scatter plots
How to use this worksheet
- Click “Download Worksheet” and sign in with Google or email to get the PDF instantly.
- Print at home or in class for High School; it's no-prep, with no extra materials needed.
- Hand it out as classwork, homework, or a quick warm-up.
Likes & comments
See what other teachers think and share a helpful note.
Loading likes and comments…
Create more worksheets in our Worksheet Studio
Generate fresh worksheets for any grade, topic, and language — free.
Open the Worksheet StudioRelated worksheets
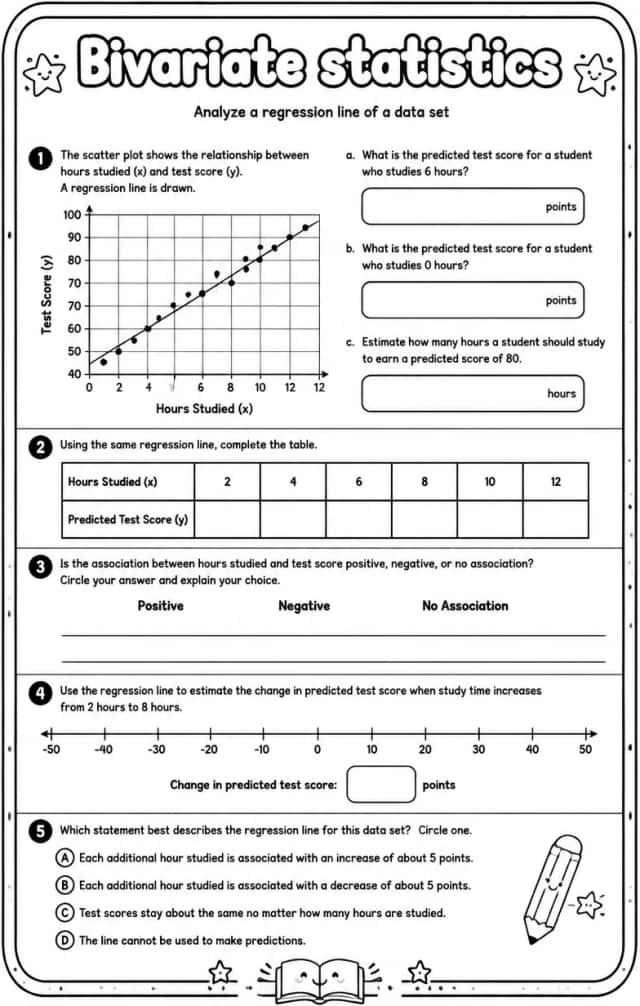
Analyze a regression line of a data set
Worksheets
hard
Ages 14–18
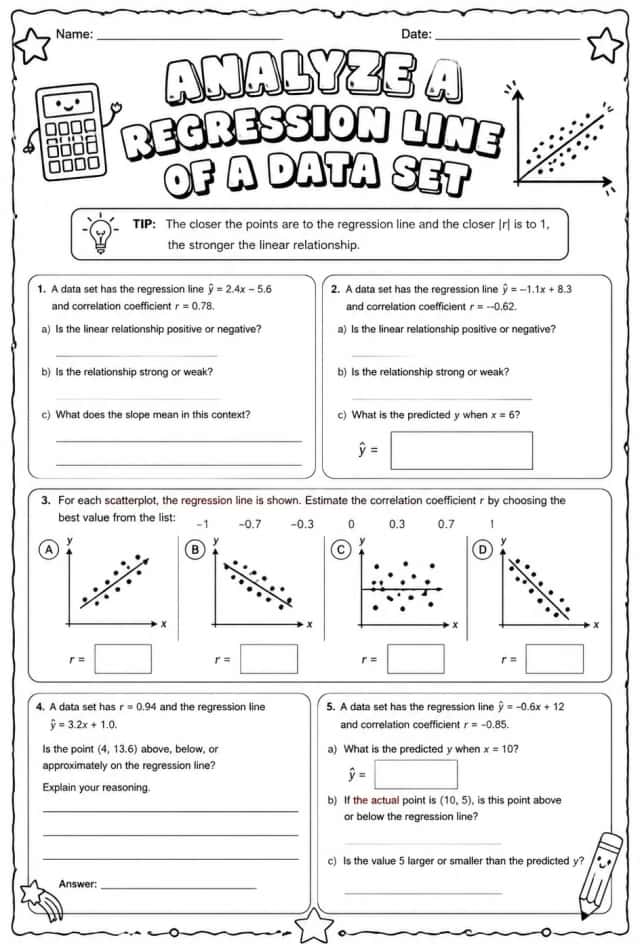
Analyze a regression line of a data set
Worksheets
hard
Ages 14–18
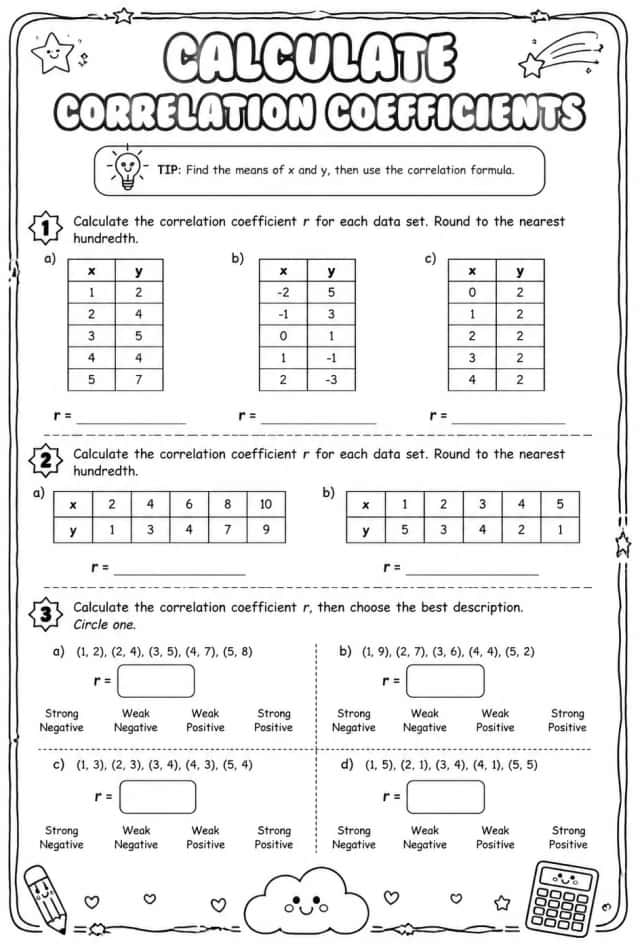
Calculate correlation coefficients
Worksheets
hard
Ages 14–18
Calculate correlation coefficients
Worksheets
hard
Ages 14–18
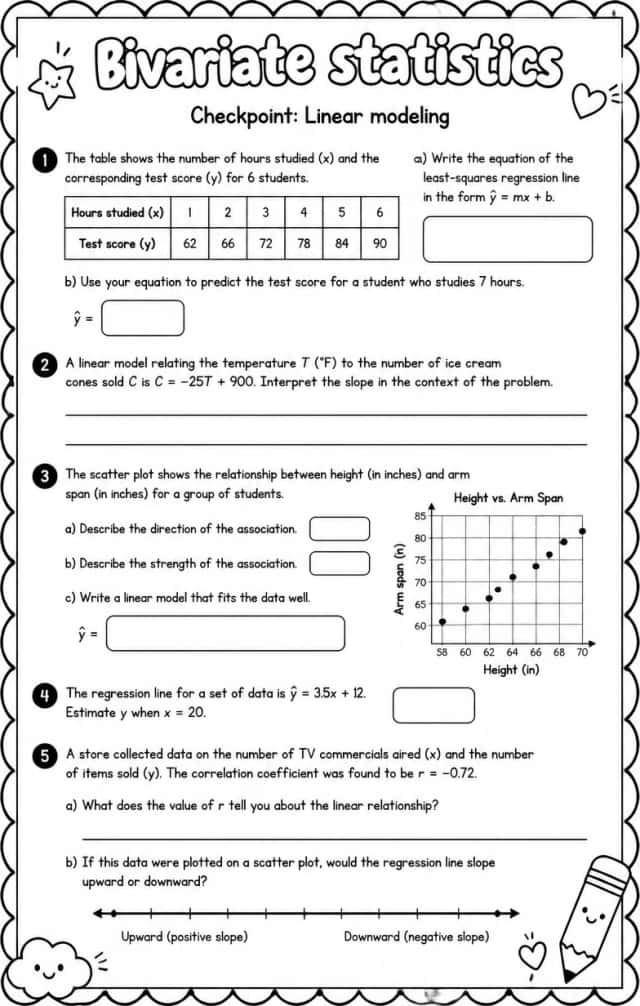
Checkpoint: Linear modeling
Worksheets
hard
Ages 14–18
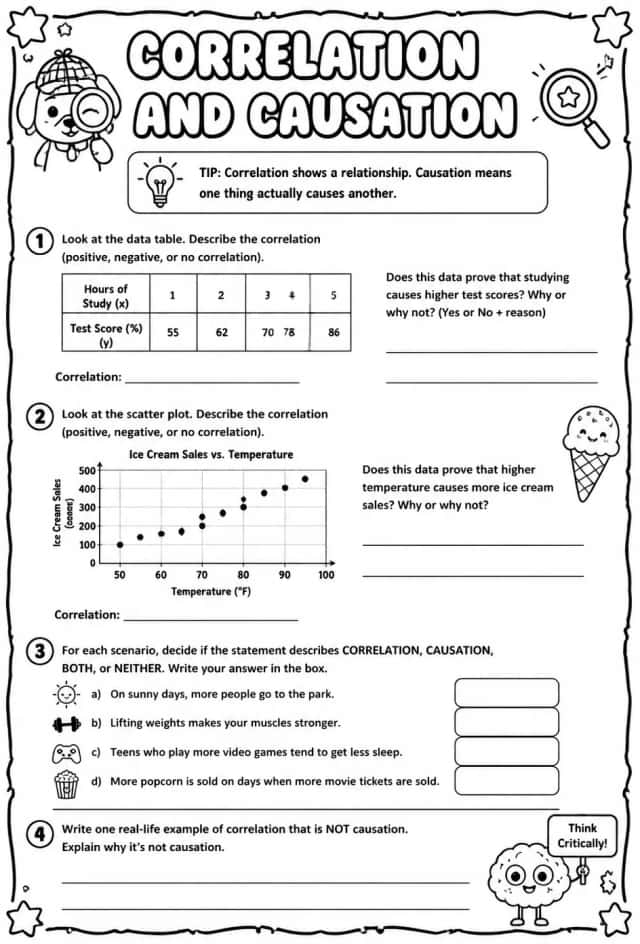
Correlation and causation
Worksheets
hard
Ages 14–18
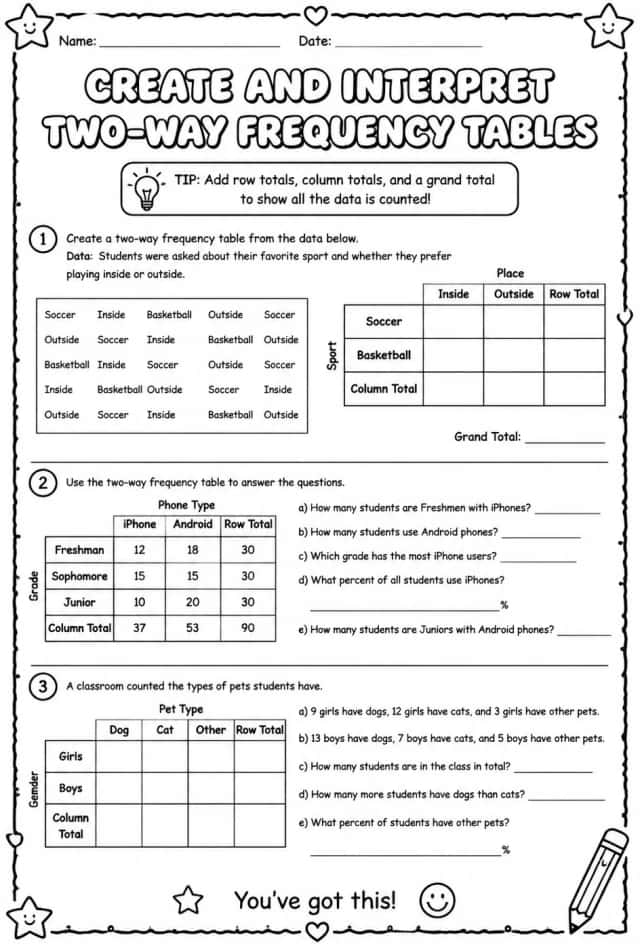
Create and interpret two-way frequency tables
Worksheets
hard
Ages 14–18
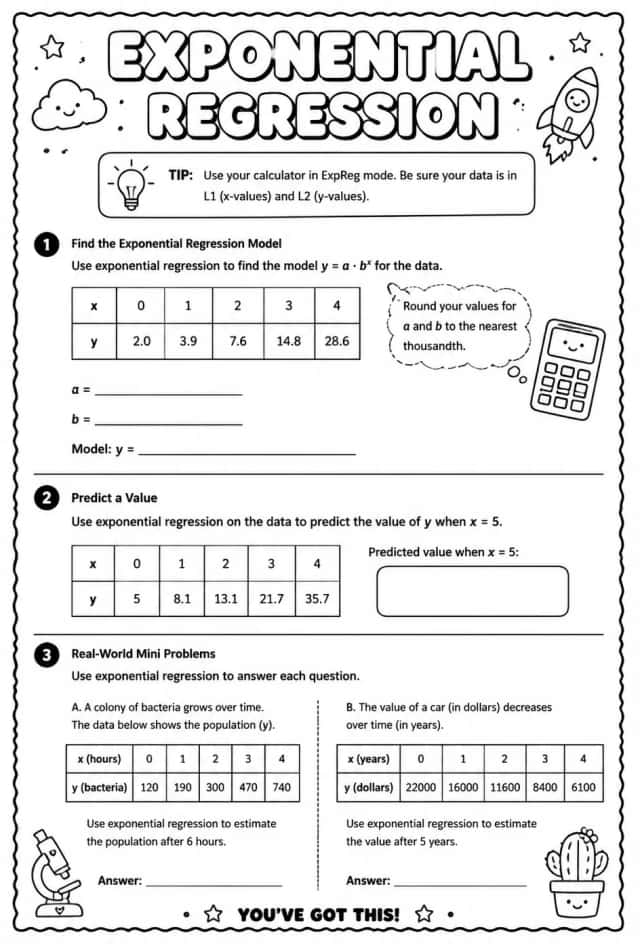
Exponential regression
Worksheets
hard
Ages 14–18