KiwiBee printable
Interpret bar graphs: multi-digit numbers
Free printable Grade 3 math worksheet for "Interpret bar graphs: multi-digit numbers" — practice data and graphs. No-prep, print or assign online.
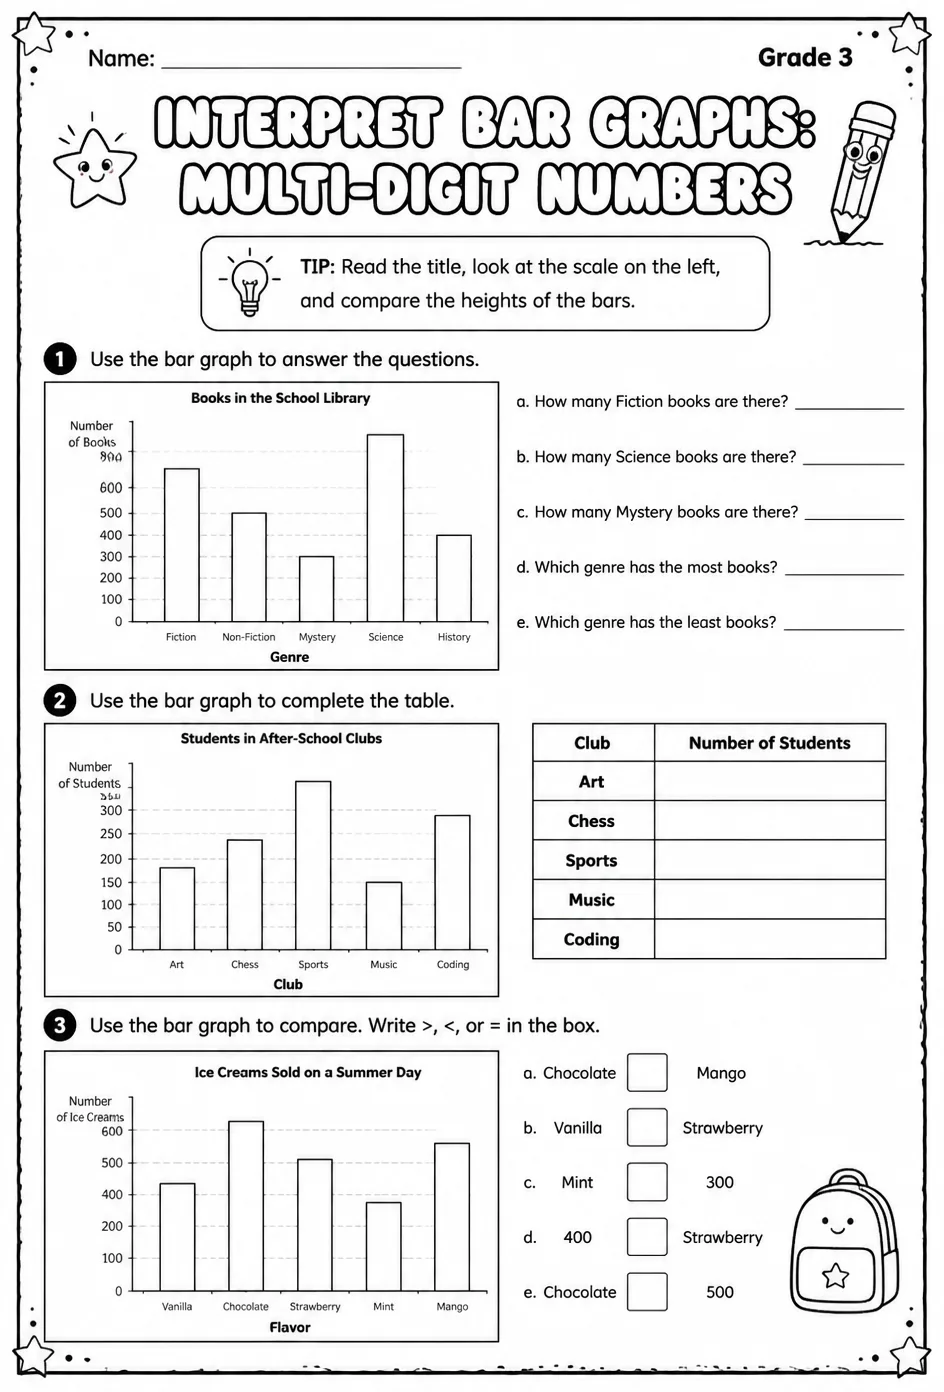
This worksheet helps students practice interpreting bar graphs that display multi-digit numbers, enhancing their data analysis skills. Teachers can use it to reinforce concepts in data and graphs, supporting students in reading and understanding graphical information. Ideal for Grade 3 math lessons focused on data representation and interpretation.
Learning objectives
- Analyze bar graphs to identify values represented by multi-digit numbers
- Compare quantities using bar graphs to answer questions accurately
- Interpret data from bar graphs to draw conclusions about given information
How to use this worksheet
- Select “Sign in to download free”, then sign in with Google or email to get the PDF from KiwiBee Printables.
- Print at home or in class for Grade 3; it's no-prep, with no extra materials needed.
- Hand it out as classwork, homework, or a quick warm-up.
Likes & comments
See what other teachers think and share a helpful note.
Loading likes and comments…
Create more worksheets in our Worksheet Studio
Generate fresh worksheets for any grade, topic, and language — free.
Open the Worksheet StudioRelated worksheets
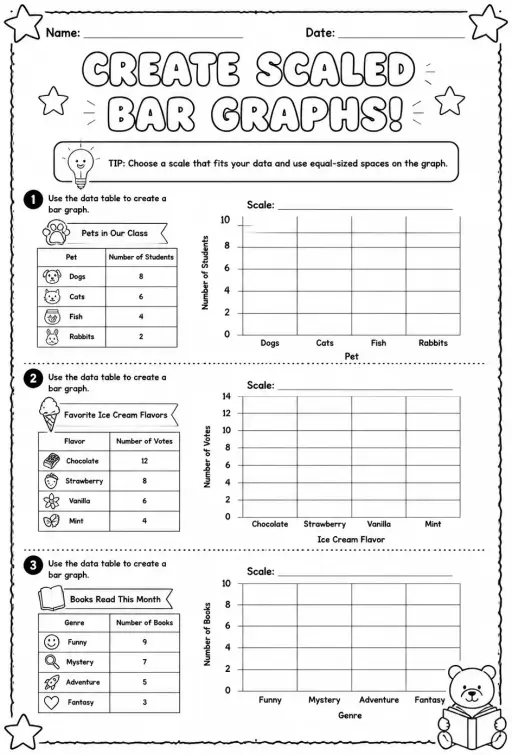
Create scaled bar graphs
Worksheets
medium
Ages 8–9
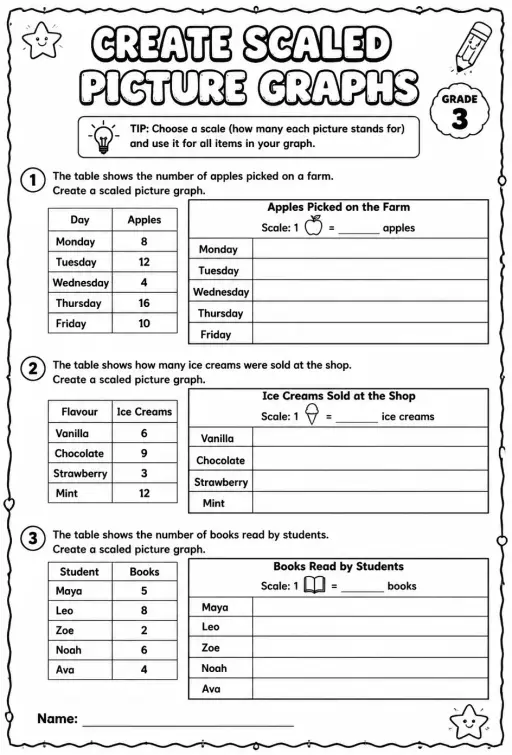
Create scaled picture graphs
Worksheets
medium
Ages 8–9
Pack
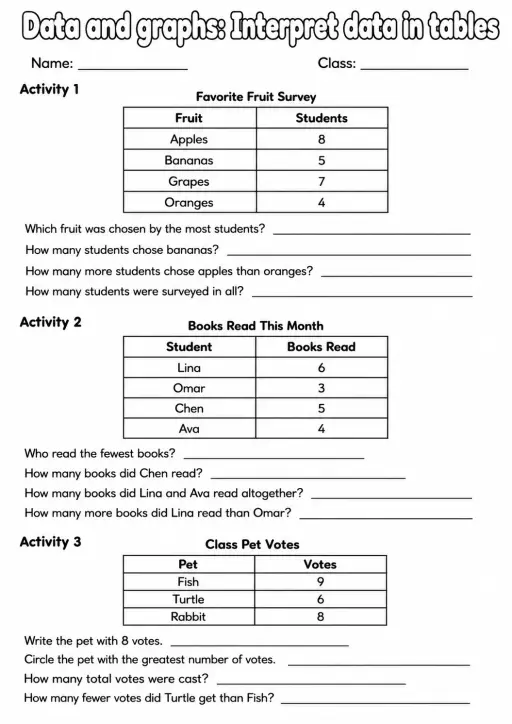
Grade 3 Data And Graphs Math Worksheet Pack
Pack
Math
medium
Ages 8–10
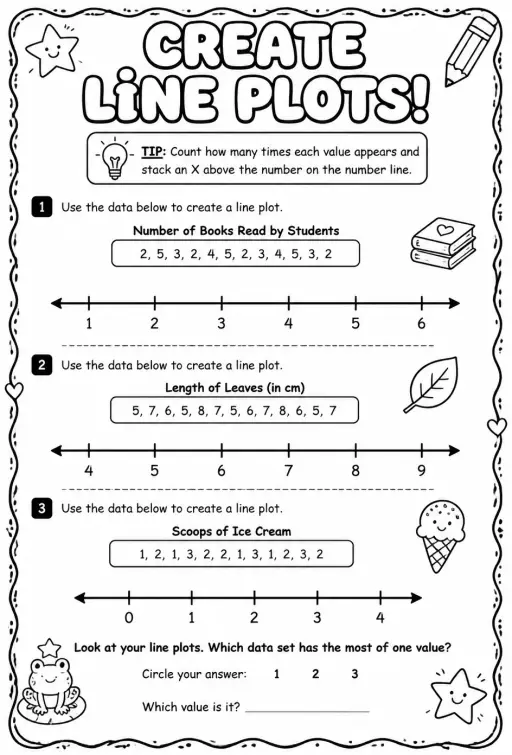
Create line plots
Worksheets
medium
Ages 8–9
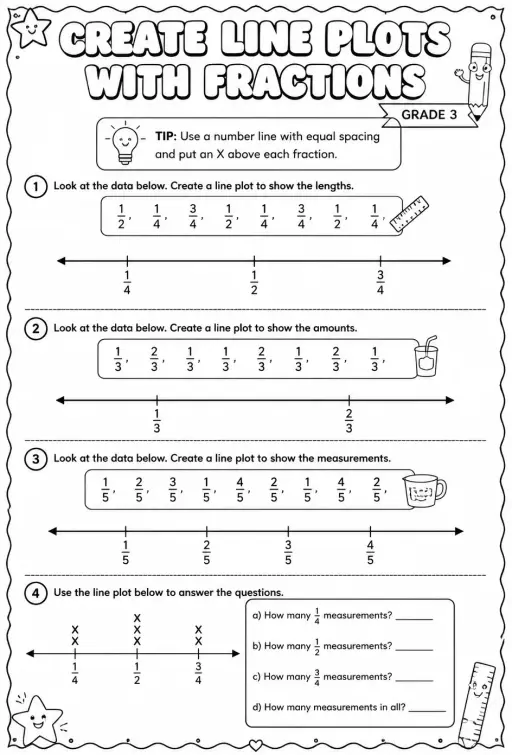
Create line plots with fractions
Worksheets
medium
Ages 8–9
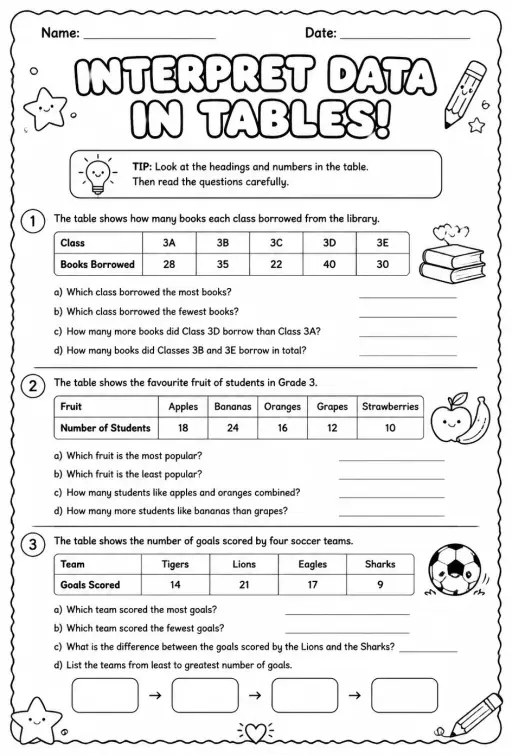
Interpret data in tables
Worksheets
medium
Ages 8–9
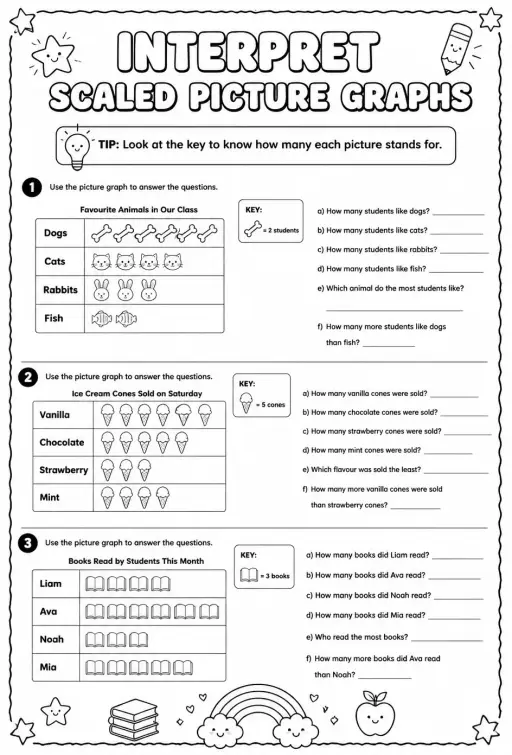
Interpret scaled picture graphs
Worksheets
medium
Ages 8–9

Create and interpret line plots with fractions
Worksheets
medium
Ages 8–9
 For big organisations
 For schools
 For centers
 For team leaders
 For teachers
 AI and resources
 Printable worksheets
 Interactive simulations
 Teacher tools
 AI studio
 Ideas and research