KiwiBee printable
Create scaled bar graphs
Free printable Grade 3 math worksheet for "Create scaled bar graphs" — practice data and graphs. No-prep, print or assign online.
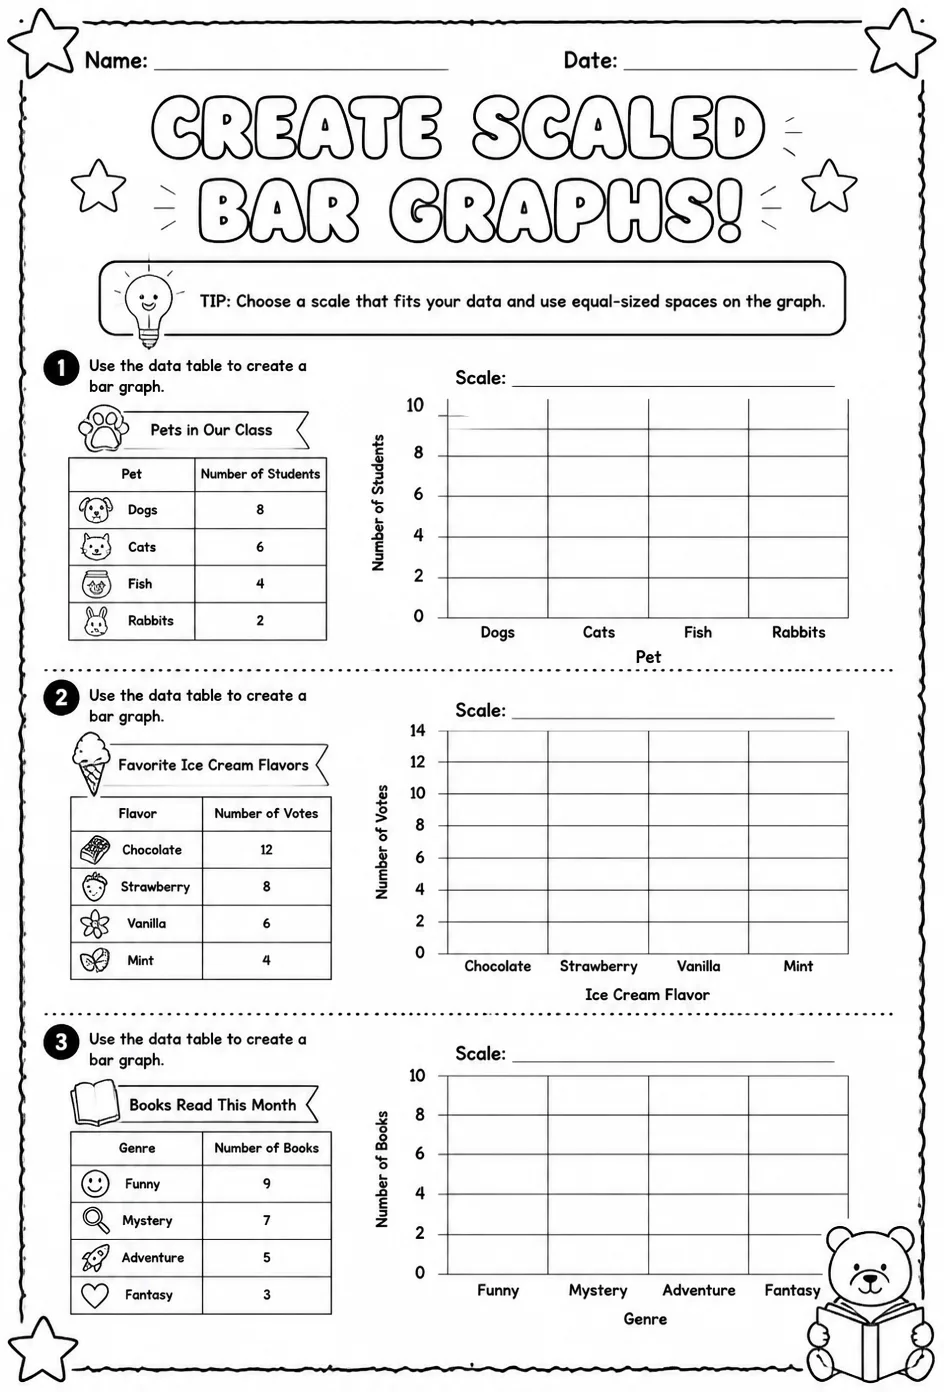
This worksheet guides students through creating scaled bar graphs based on provided data sets, reinforcing their understanding of data representation. Teachers can use it to support lessons on data interpretation and graphical skills in Grade 3 math. It provides practice in selecting suitable scales and accurately plotting data, enhancing students' ability to visualize and analyze information.
Learning objectives
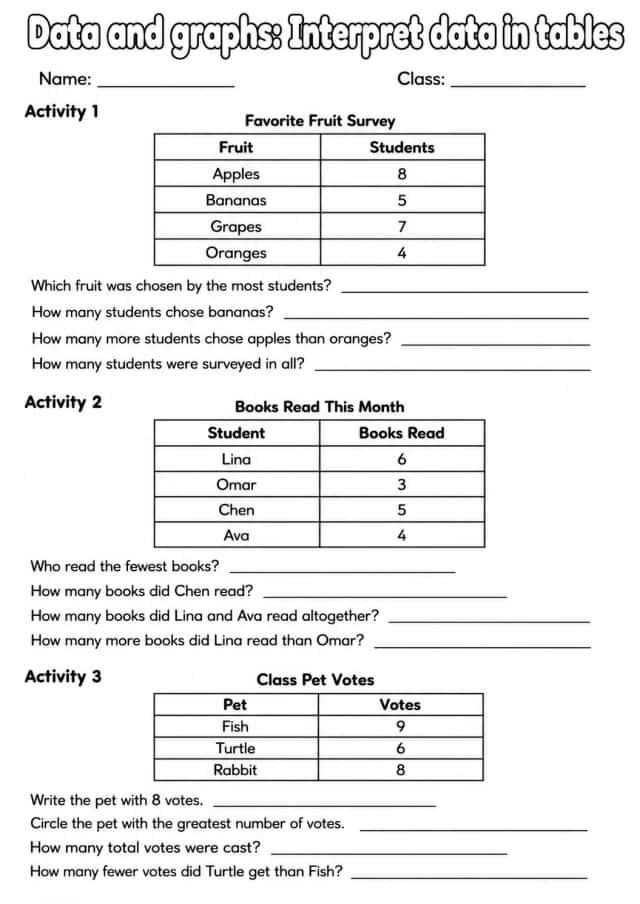
- Interpret data to determine appropriate scales for bar graphs
- Construct scaled bar graphs accurately using given data sets
- Analyze bar graphs to answer questions about data trends and comparisons
How to use this worksheet
- Click “Download Worksheet” and sign in with Google or email to get the PDF instantly.
- Print at home or in class for Grade 3; it's no-prep, with no extra materials needed.
- Hand it out as classwork, homework, or a quick warm-up.
Likes & comments
See what other teachers think and share a helpful note.
Loading likes and comments…
Create more worksheets in our Worksheet Studio
Generate fresh worksheets for any grade, topic, and language — free.
Open the Worksheet StudioRelated worksheets
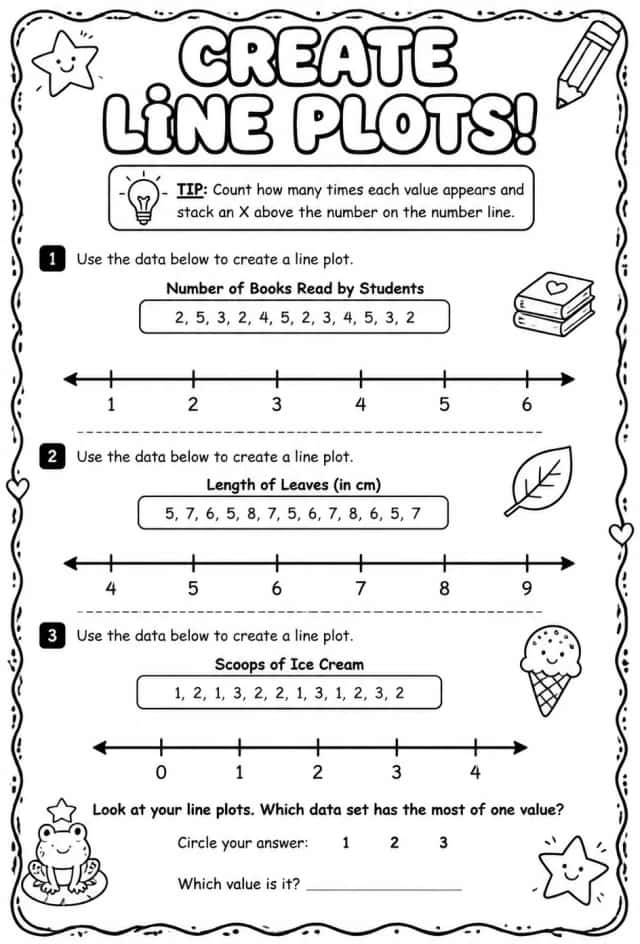
Create line plots
Worksheets
medium
Ages 8–9
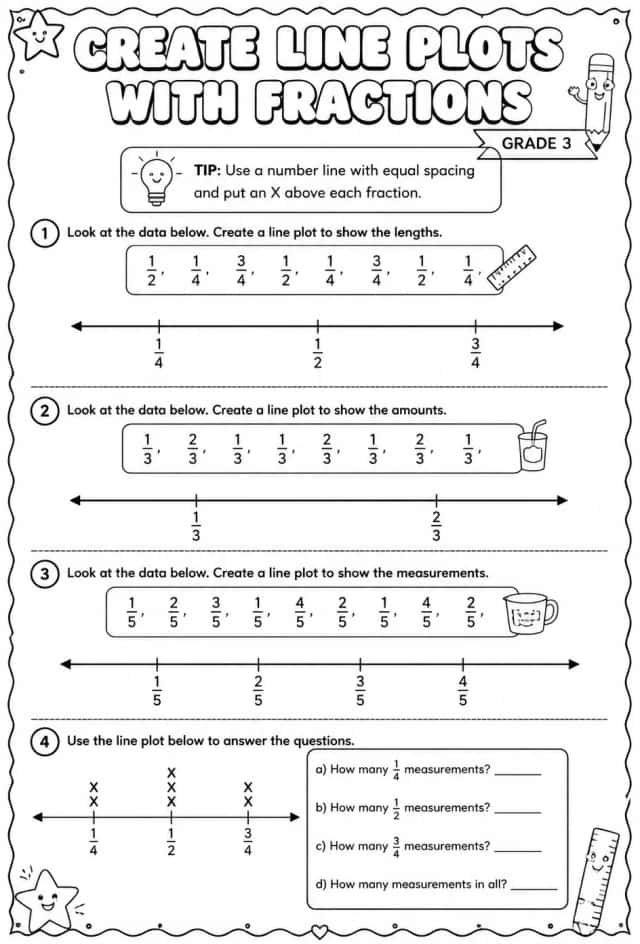
Create line plots with fractions
Worksheets
medium
Ages 8–9
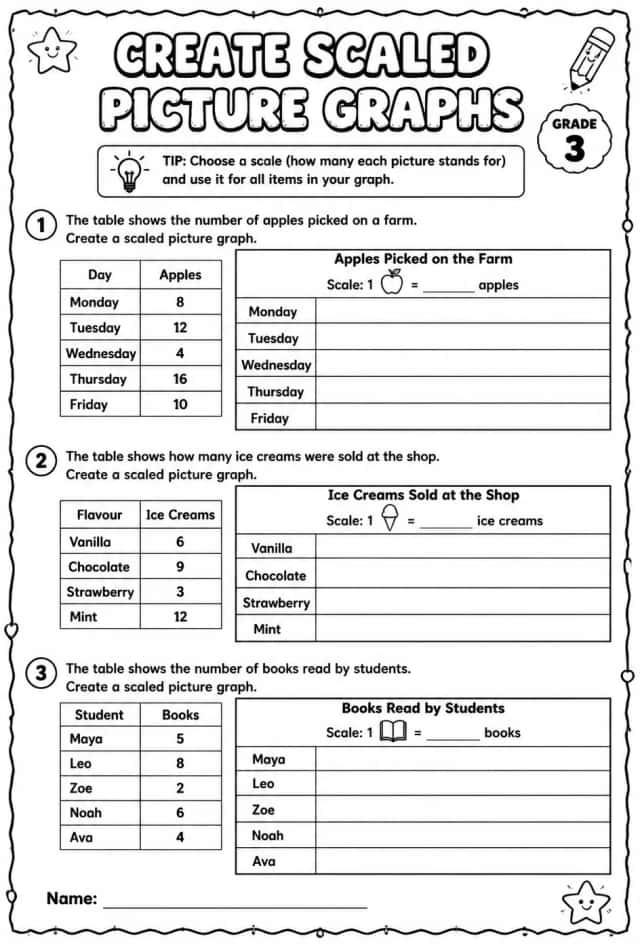
Create scaled picture graphs
Worksheets
medium
Ages 8–9
Pack
Grade 3 Data And Graphs Math Worksheet Pack
Pack
math
medium
Ages 8–10
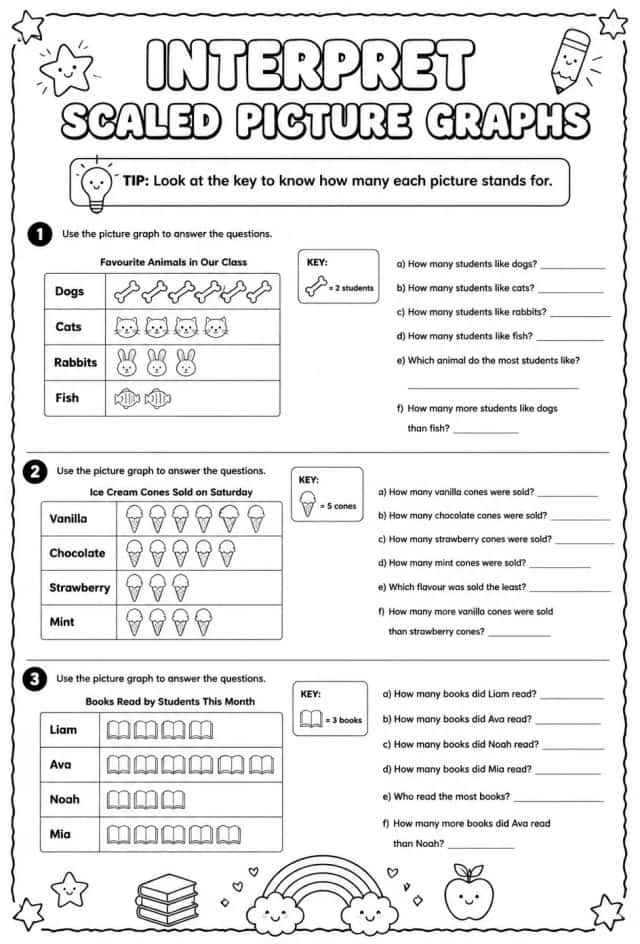
Interpret scaled picture graphs
Worksheets
medium
Ages 8–9
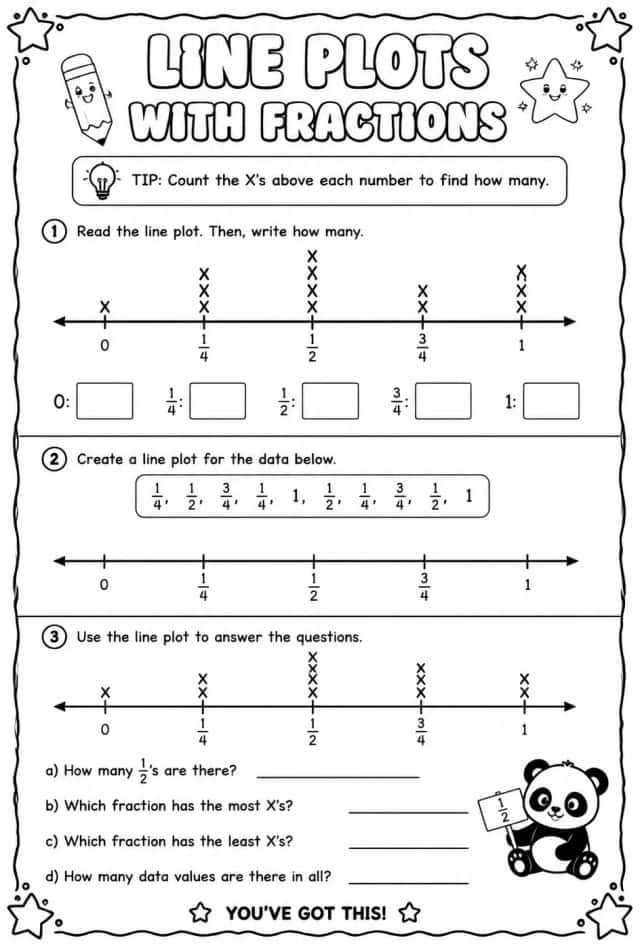
Create and interpret line plots with fractions
Worksheets
medium
Ages 8–9
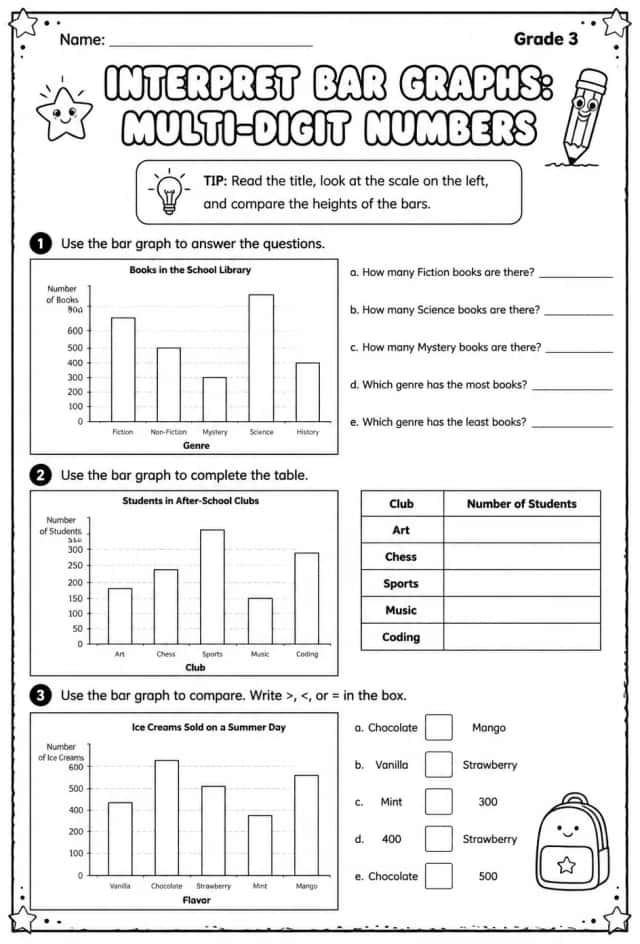
Interpret bar graphs: multi-digit numbers
Worksheets
medium
Ages 8–9
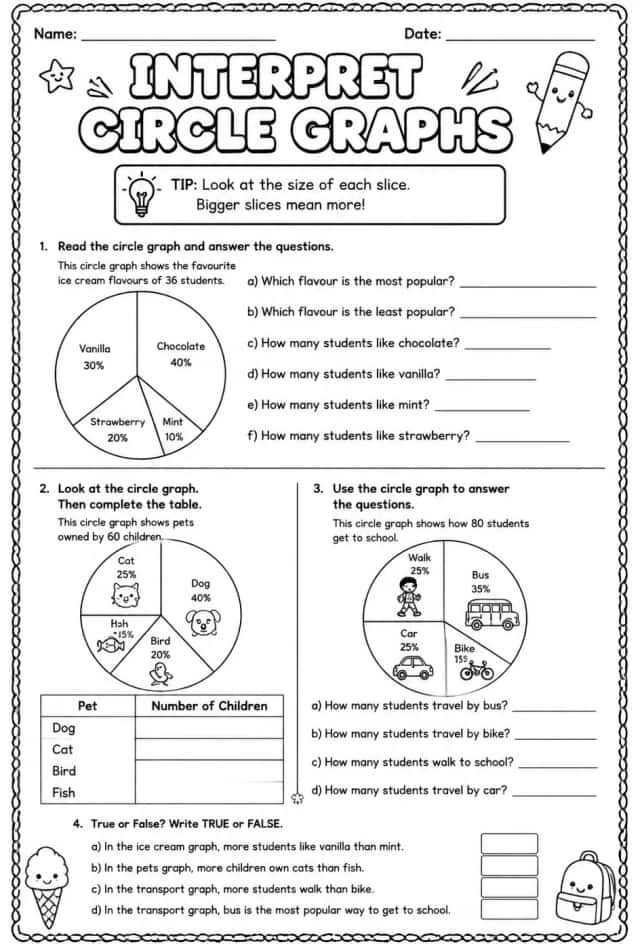
Interpret circle graphs
Worksheets
medium
Ages 8–9