KiwiBee printable
Checkpoint: Scatter plots
Free printable Grade 8 math worksheet for "Checkpoint: Scatter plots" — practice two-variable statistics. No-prep, print or assign online.
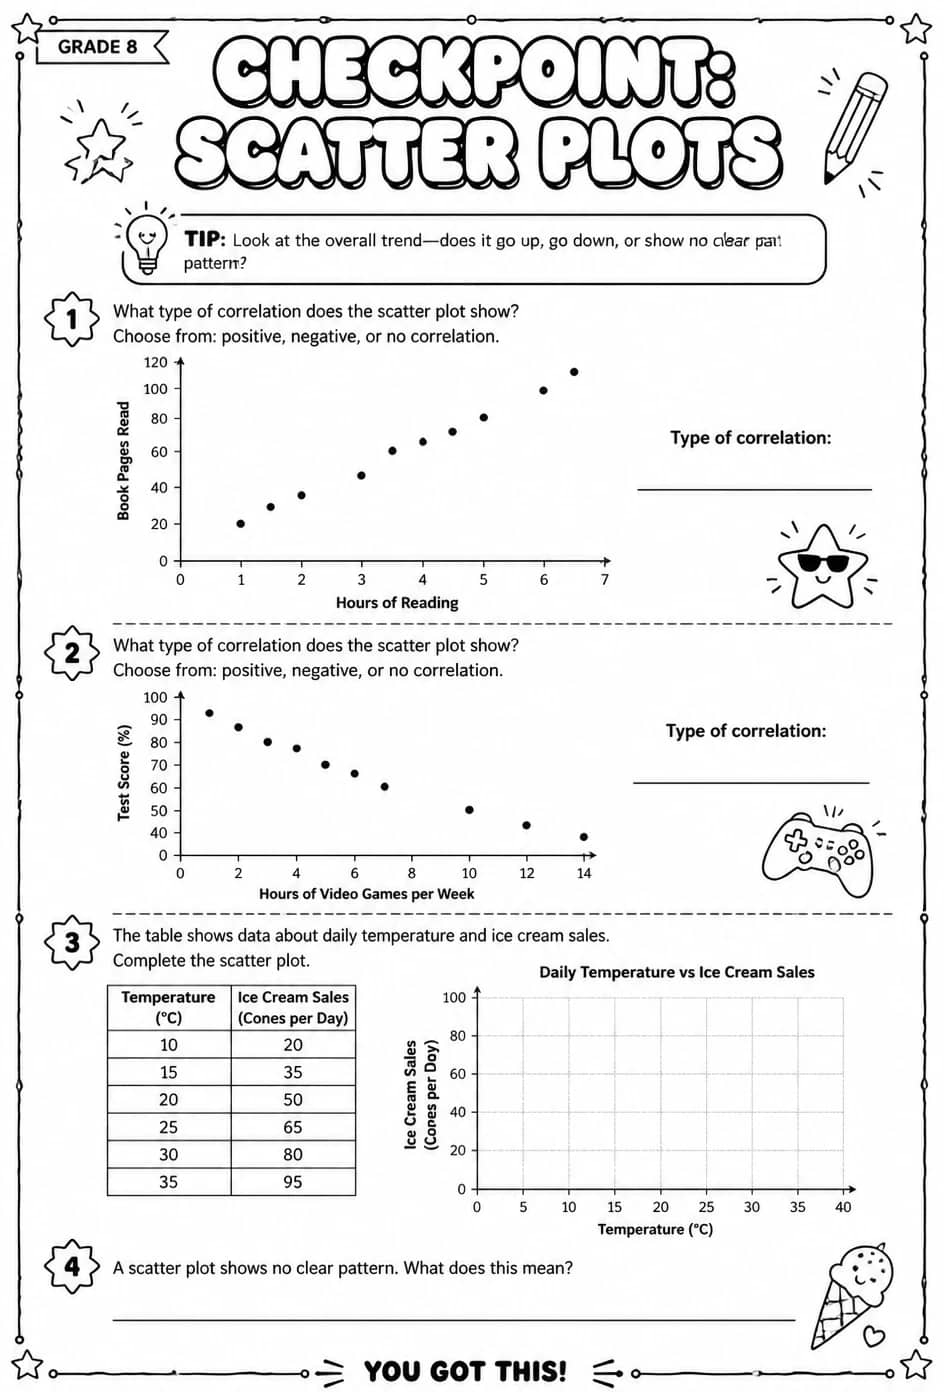
This worksheet provides a challenging checkpoint for middle school students to master scatter plots within two-variable statistics. Teachers can use it to assess students' abilities to interpret and construct scatter plots, reinforcing key concepts in data analysis and correlation. It is ideal for evaluating understanding of complex data relationships and preparing students for advanced statistical reasoning.
Learning objectives
- Interpret scatter plots to identify patterns and relationships between two variables
- Analyze data points to determine correlation types such as positive, negative, or no correlation
- Construct scatter plots accurately using given data sets to visualize two-variable statistics
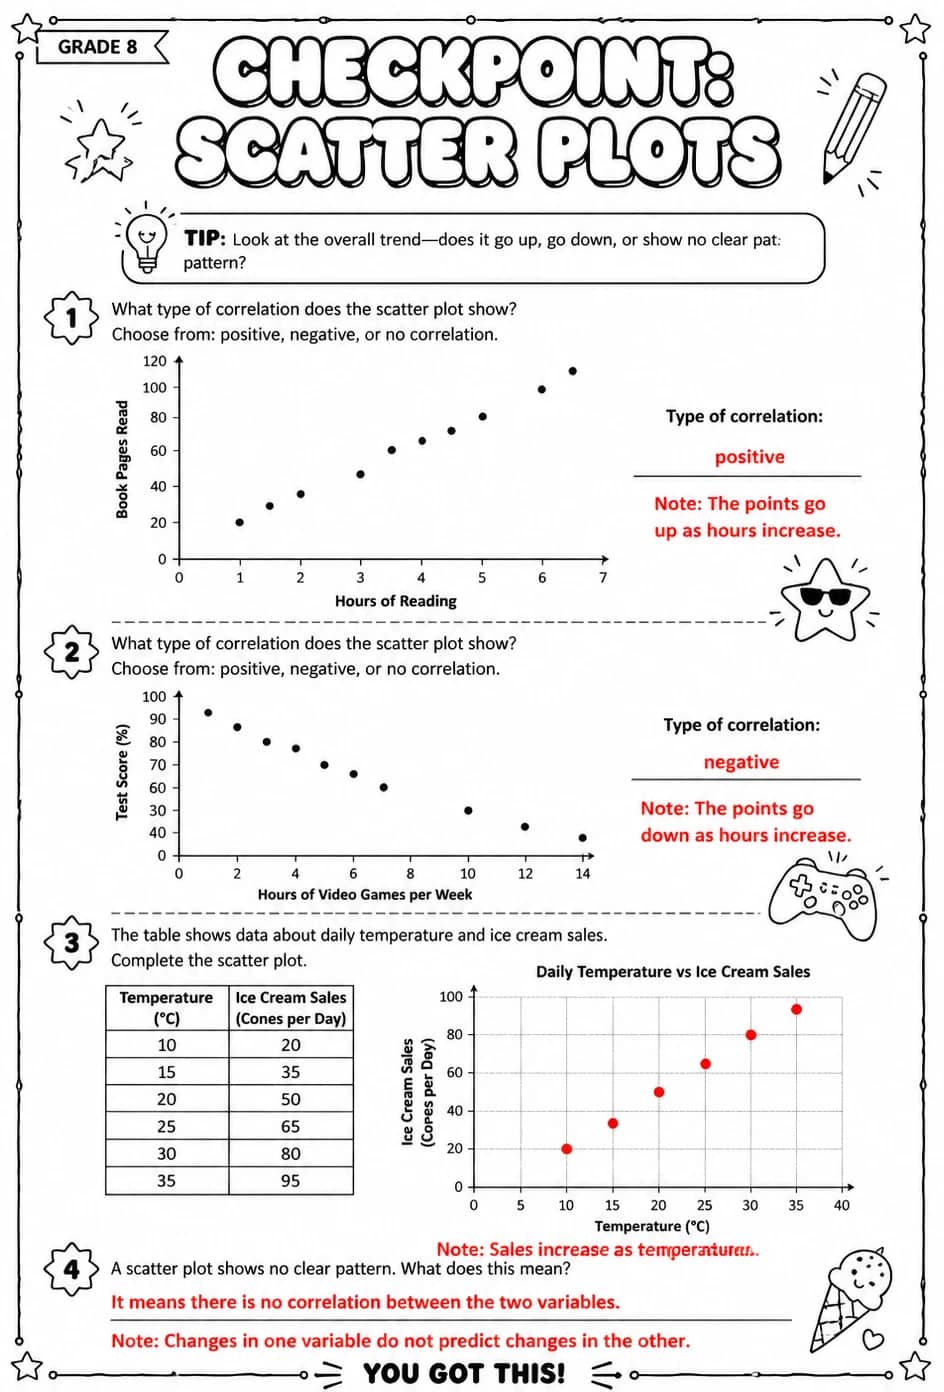
Answer Key
How to use this worksheet
- Select “Sign in to download free”, then sign in with Google or email to get the PDF from KiwiBee Printables.
- Print at home or in class for Middle School; it's no-prep, with no extra materials needed.
- Use the included answer key to mark it in seconds.
Likes & comments
See what other teachers think and share a helpful note.
Loading likes and comments…
Create more worksheets in our Worksheet Studio
Generate fresh worksheets for any grade, topic, and language — free.
Open the Worksheet StudioRelated worksheets
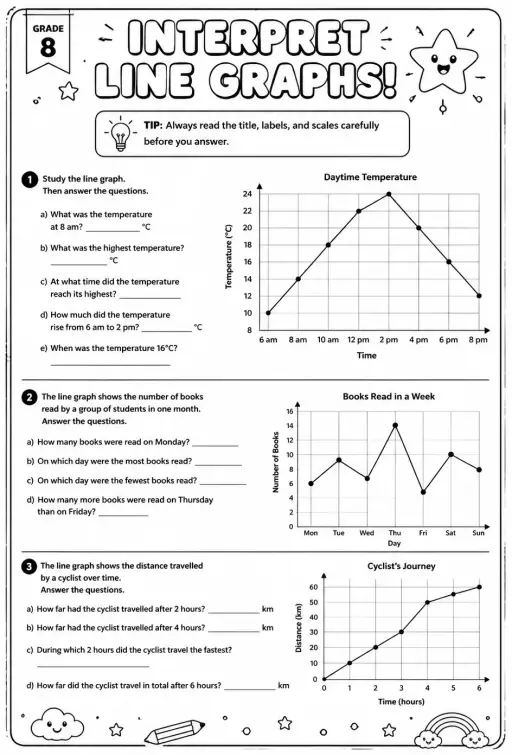
Interpret line graphs
Worksheets
hard
Ages 11–14
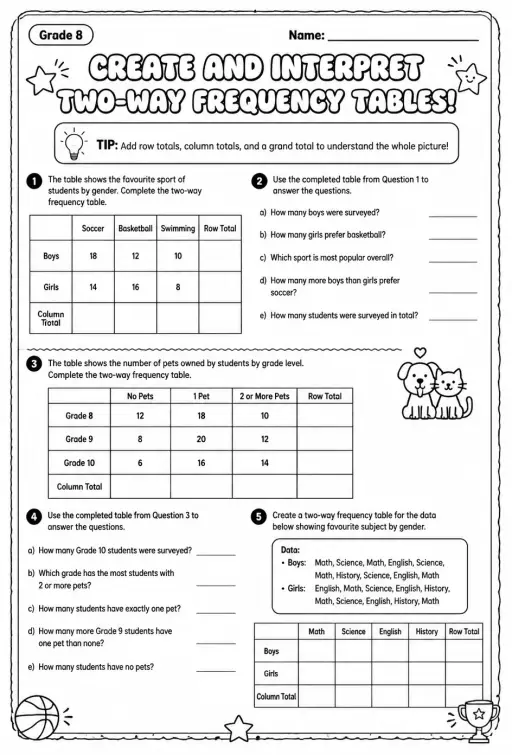
Create and interpret two-way frequency tables
Worksheets
hard
Ages 11–14
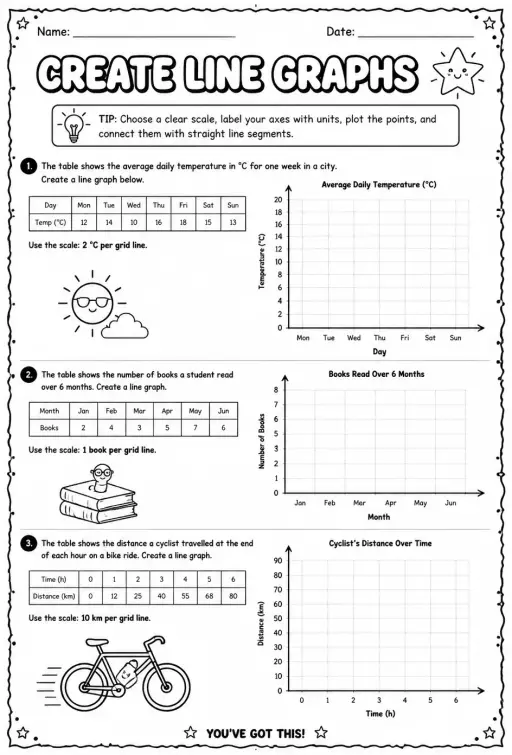
Create line graphs
Worksheets
hard
Ages 11–14
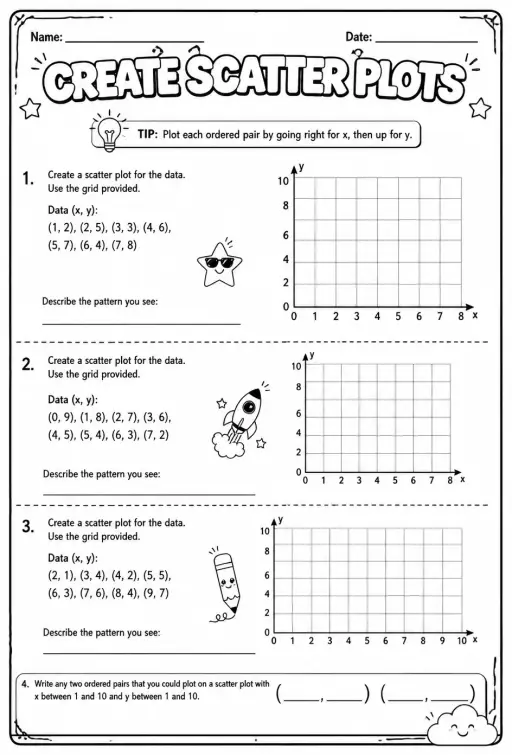
Create scatter plots
Worksheets
hard
Ages 11–14
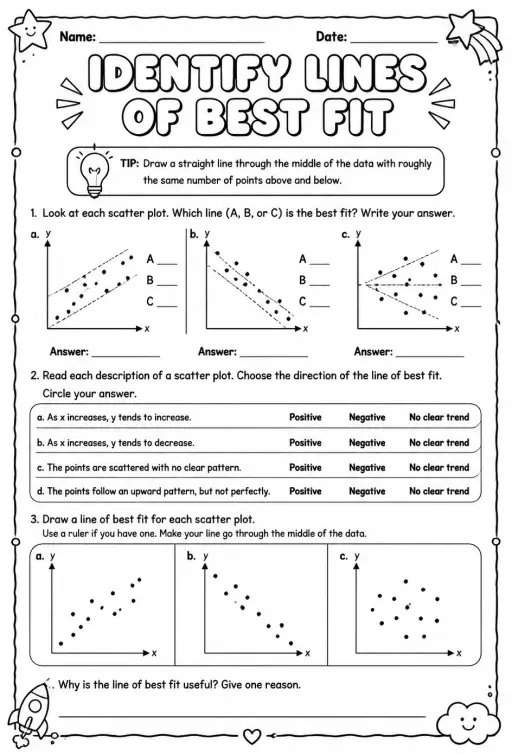
Identify lines of best fit
Worksheets
hard
Ages 11–14
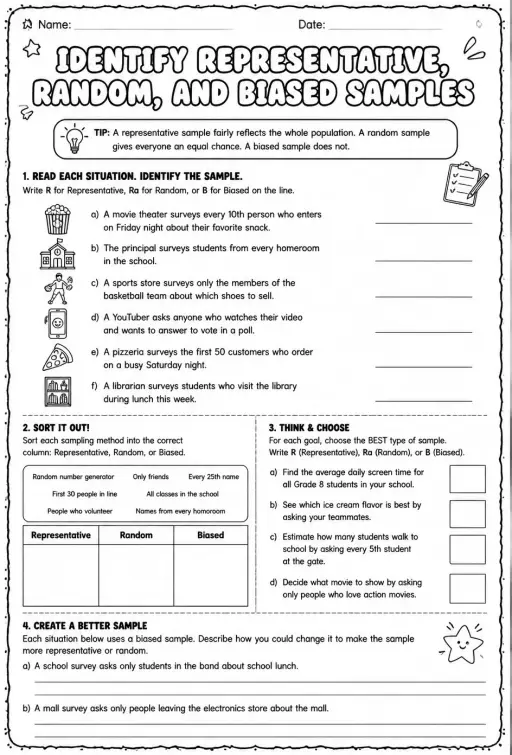
Identify representative, random, and biased samples
Worksheets
hard
Ages 11–14
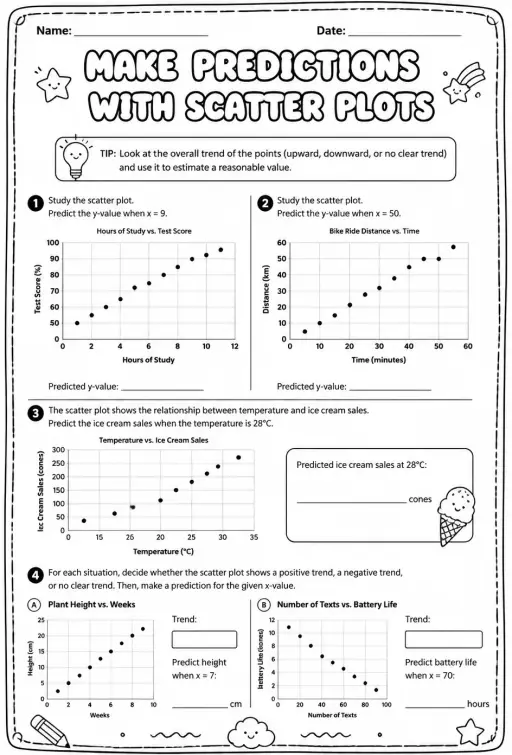
Make predictions with scatter plots
Worksheets
hard
Ages 11–14
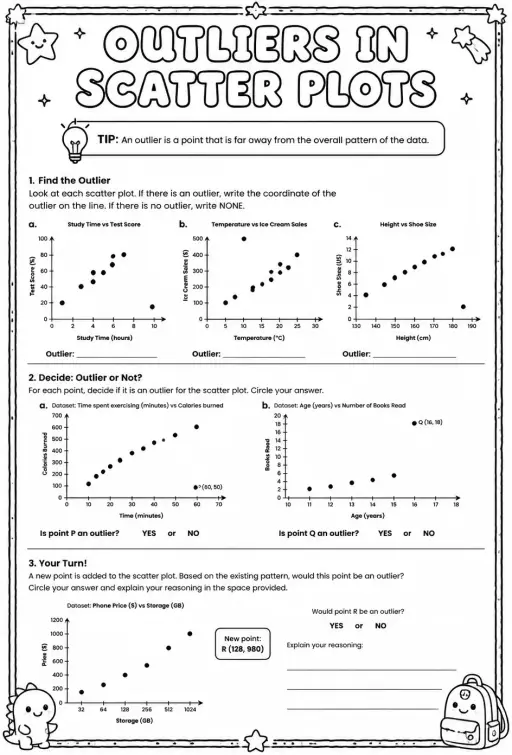
Outliers in scatter plots
Worksheets
hard
Ages 11–14
 For big organisations
 For schools
 For centers
 For team leaders
 For teachers
 AI and resources
 Printable worksheets
 Interactive simulations
 Teacher tools
 AI studio
 Ideas and research