KiwiBee printable
Outliers in scatter plots
Free printable Grade 8 math worksheet for "Outliers in scatter plots" — practice two-variable statistics. No-prep, print or assign online.
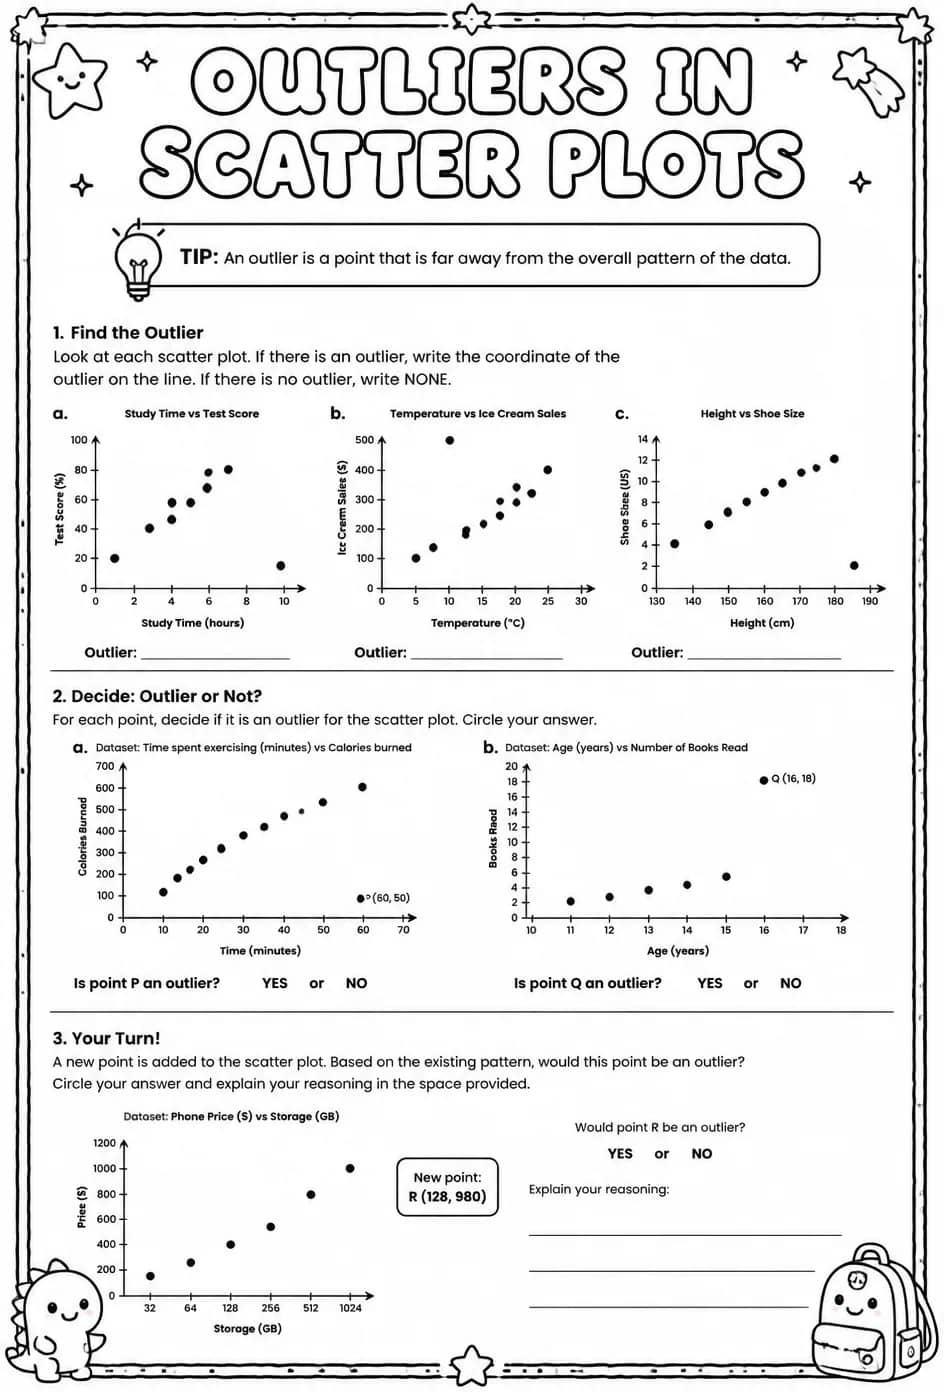
This worksheet focuses on recognizing and interpreting outliers within scatter plots for two-variable statistics. Teachers can use it to reinforce students' ability to analyze data distributions and understand how outliers affect data trends. Ideal for grade 8 math classes, it supports developing critical thinking in data analysis and enhances skills in identifying anomalies in graphical data representations.
Learning objectives
- Identify outliers in scatter plots representing two-variable data sets
- Explain the impact of outliers on the interpretation of scatter plots
- Analyze scatter plots to distinguish between typical data points and outliers
How to use this worksheet
- Click “Download Worksheet” and sign in with Google or email to get the PDF instantly.
- Print at home or in class for Middle School; it's no-prep, with no extra materials needed.
- Hand it out as classwork, homework, or a quick warm-up.
Likes & comments
See what other teachers think and share a helpful note.
Loading likes and comments…
Create more worksheets in our Worksheet Studio
Generate fresh worksheets for any grade, topic, and language — free.
Open the Worksheet StudioRelated worksheets
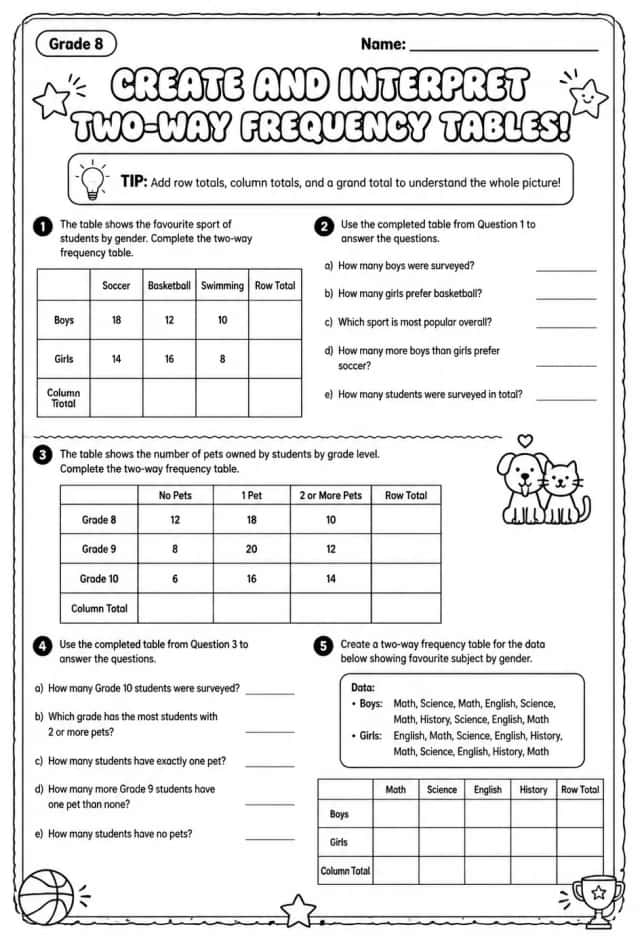
Create and interpret two-way frequency tables
Worksheets
hard
Ages 11–14
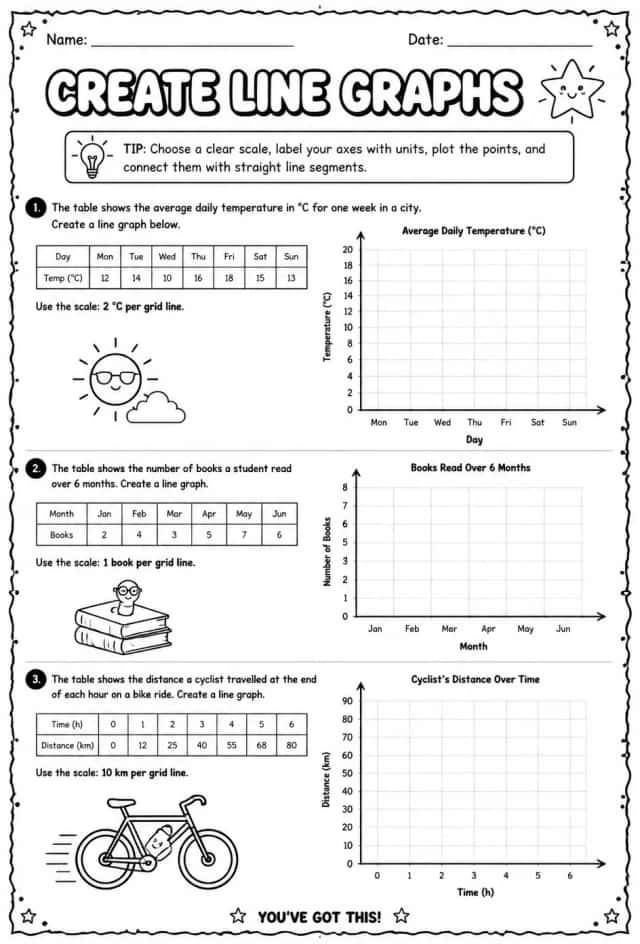
Create line graphs
Worksheets
hard
Ages 11–14
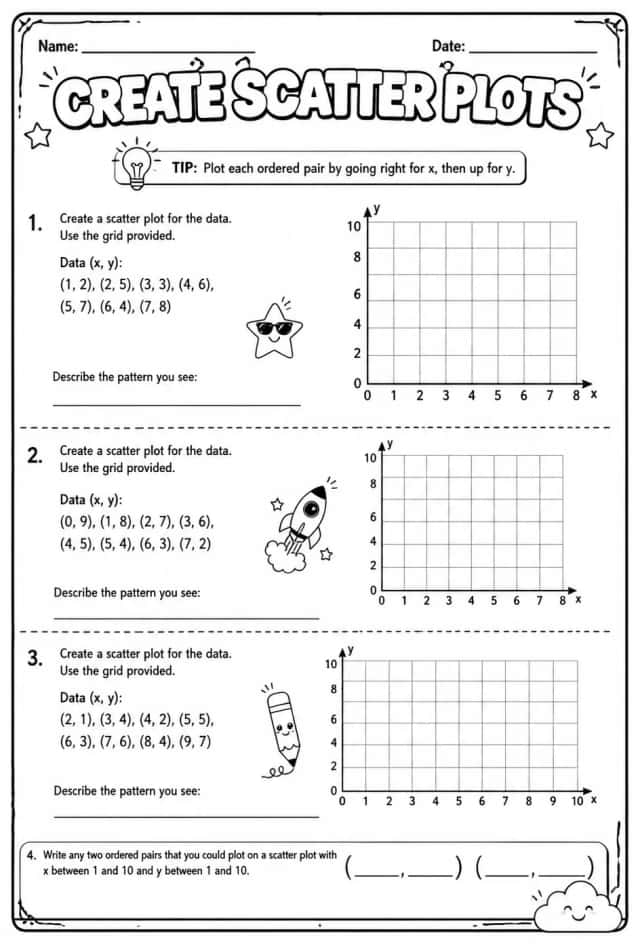
Create scatter plots
Worksheets
hard
Ages 11–14
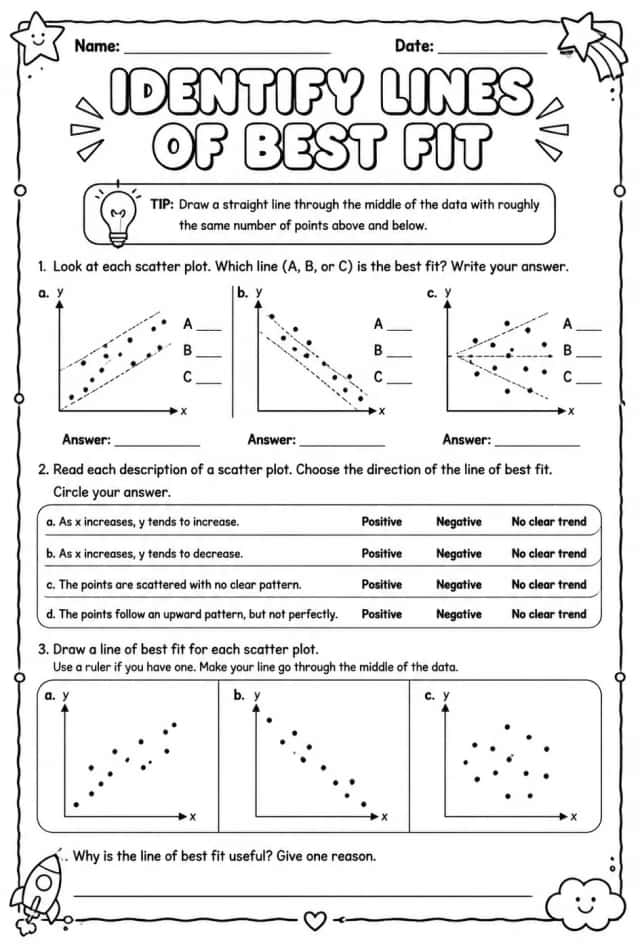
Identify lines of best fit
Worksheets
hard
Ages 11–14
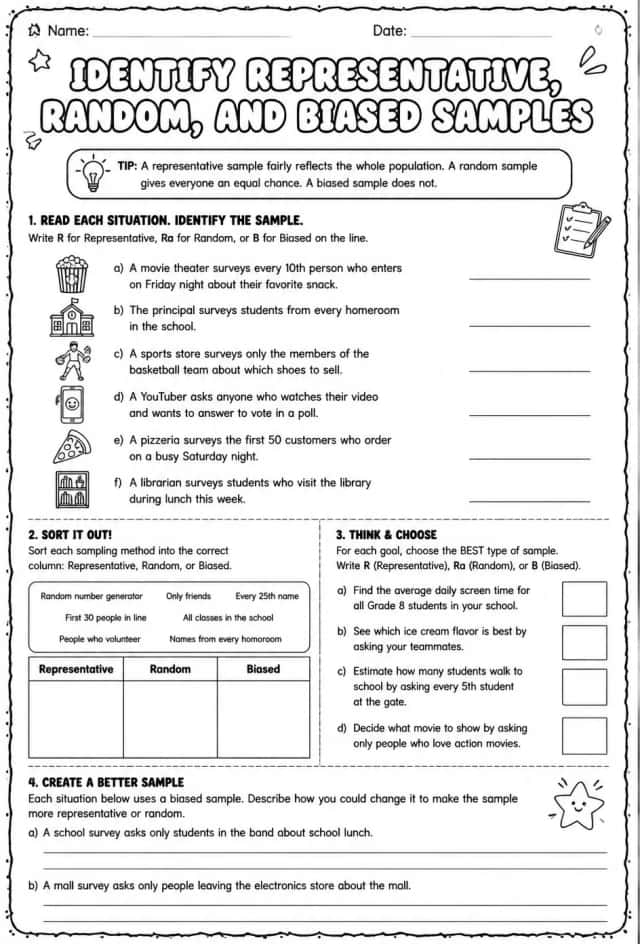
Identify representative, random, and biased samples
Worksheets
hard
Ages 11–14
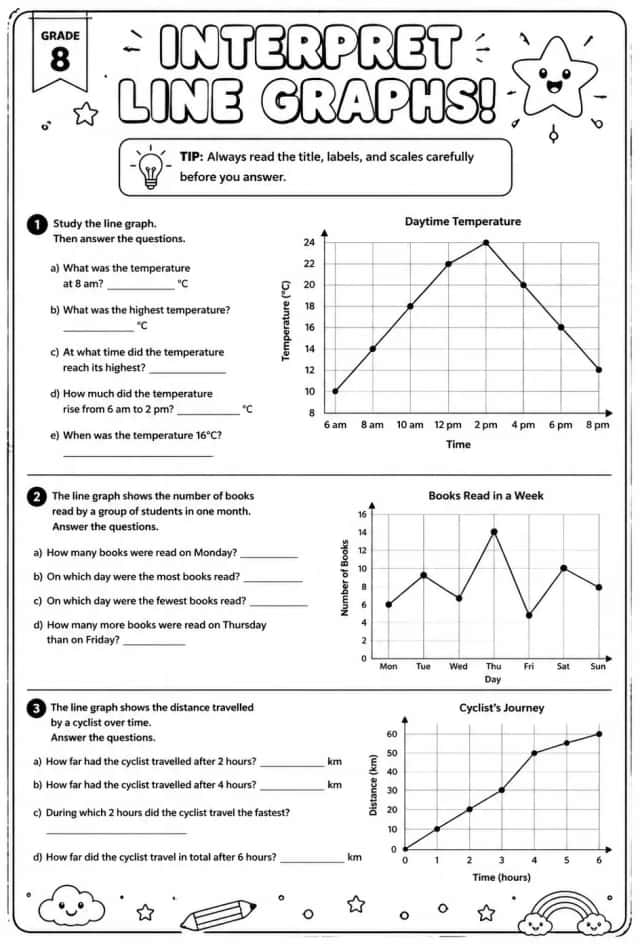
Interpret line graphs
Worksheets
hard
Ages 11–14
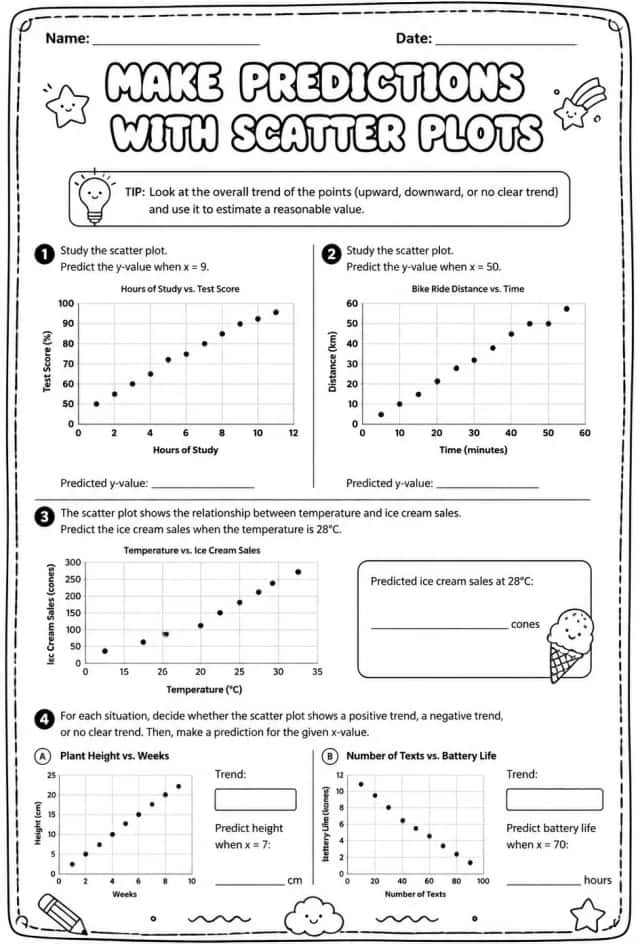
Make predictions with scatter plots
Worksheets
hard
Ages 11–14
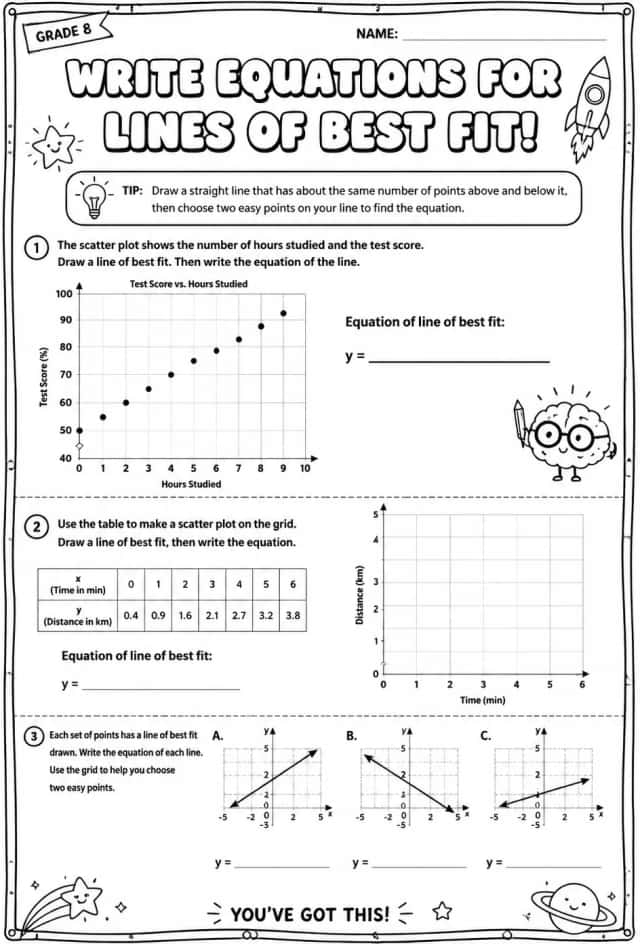
Write equations for lines of best fit
Worksheets
hard
Ages 11–14