Leveraging ClassDojo Data for Enhanced Classroom Decision-Making
How to turn behavior tracking data into actionable insights for reports, rewards, and team formation.
 By KiwiBee· KiwiBee
Last updated July 11, 2026
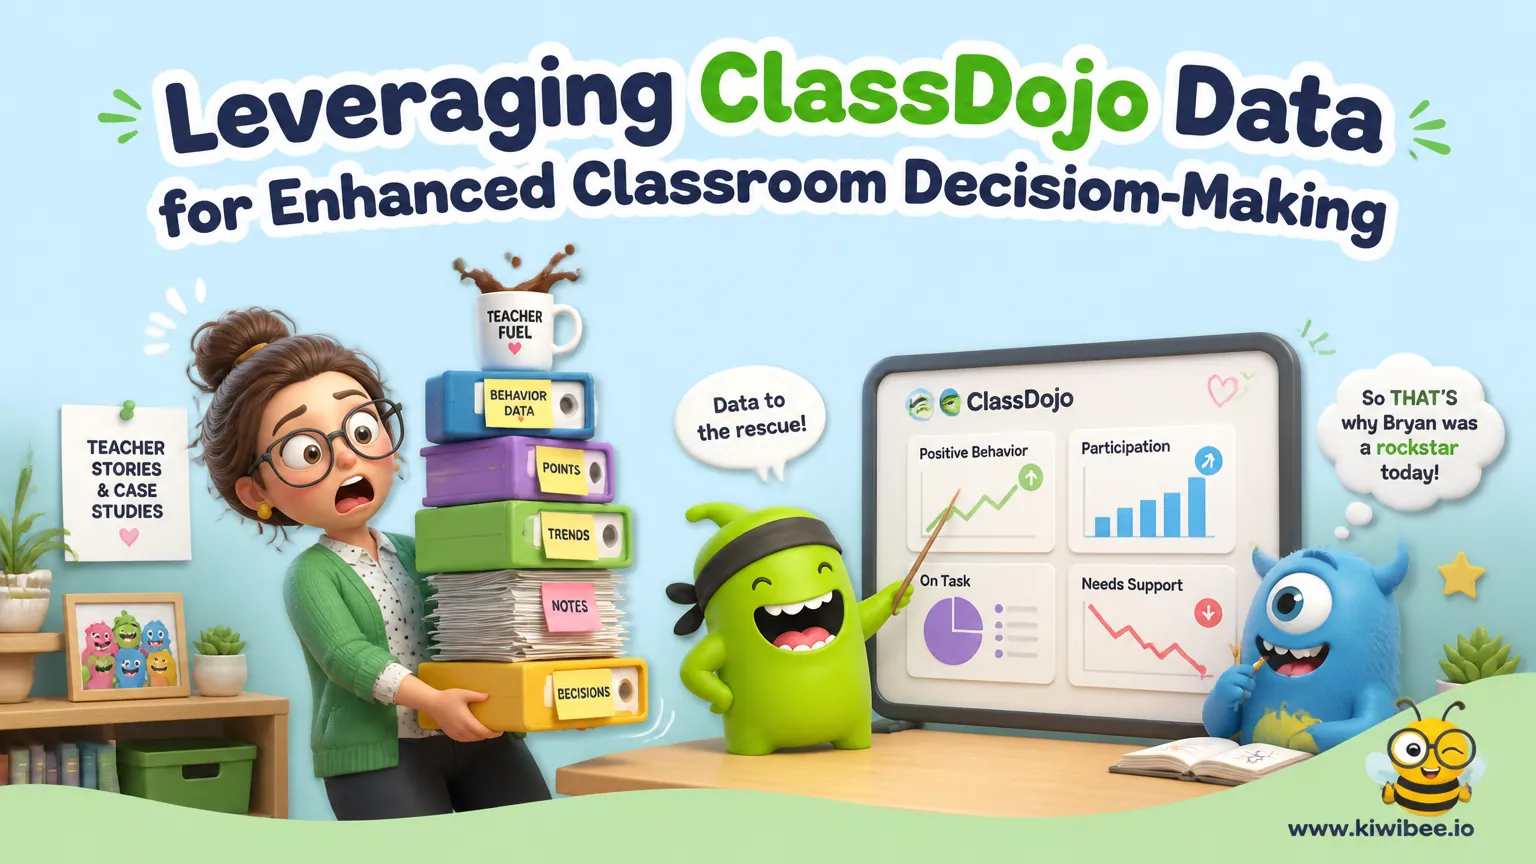
Three ways I actually use the ClassDojo data, and one I never figured out
ClassDojo collects more data than any teacher I know actually uses. For two years I logged points dutifully and looked at the dashboards never. Then I committed to using the data for three specific decisions every term, and the difference in my classroom was bigger than any single curriculum change I made that year. Here are the three, and the one decision the data still does not help me with.
1. Generating student reports from behaviour data
End-of-term reports used to be guesswork. 'Sarah participates well in class' — does she? When did I decide that? The ClassDojo data answers this honestly. I export the term's data and look at the frequency of positive behaviours (Participation, Helping Others, On Task, Persistence) and the frequency of behaviours needing improvement (Off Task, Disruptive, Not Following Directions) for each student.
For Sarah's report I can now write: 'Sarah's participation increased by 35% this term, and off-task incidents dropped from 12 in October to 3 in December.' That sentence is defensible, specific, and actionable for her parents. The parent on the receiving end of vague feedback always wants this kind of evidence. The data was always there — I just had to commit to using it.
How I present it: weekly summary for the kids who need quick feedback, monthly progress report for the whole class, individual reports for kids on intervention plans, and visual charts (bar graph for behaviour frequency, line graph for trend over time) for parent meetings. Visuals do more work in five seconds than a paragraph does in five minutes.
2. Data-driven reward systems
My second use: tying tangible rewards to specific point thresholds. Kids who hit 50 points in a week earn a homework pass. Kids who consistently demonstrate 'Helping Others' get nominated for Student of the Month. Kids who hit specific skill thresholds — 20 points for 'Persistence' in one term — earn a behaviour-specific certificate.
The rules that make it work: total transparency (I post the thresholds on the wall, kids can see exactly what they are working toward), absolute consistency (I award points by the same criteria every day, otherwise the system loses credibility), timely feedback (rewards arrive within a week of the threshold being hit), and flexibility (I adjust thresholds mid-term if the bar is too high or too low for a particular class).
Mix of reward types so different kids find something motivating: tangible (small prizes, stickers, classroom privileges), social (positive praise, recognition in front of the class), activity-based (extra recess, free choice, leading a class game), and privilege (line leader, teacher's helper, choosing the next class game).
3. Forming balanced teams
This is the use most teachers do not think of and that has the biggest impact on group work quality. Before I assign teams for any project, I look at ClassDojo data and balance for three things. Skill strengths — does each team have someone strong in research, writing, presenting, or facilitating? Behavioural strengths — does each team have at least one kid with strong Leadership or Teamwork scores? Mixed ability — no team should be stacked with high-flyers or struggling kids.
The trick: I do not tell the kids how I formed the teams. They think it is random. Magic happens when a quiet kid who scored high on Helping Others ends up paired with the loud kid who needs Helping Others modelled to him. That kind of pairing used to be luck. Now it is data.
The one I never figured out
ClassDojo data tells me about behaviour. It does not tell me about academic mastery. So when a kid is participating well but not learning, the dashboard cheers them on while I am pulling my hair out. For two years I tried to bolt academic data onto ClassDojo and gave up.
Explore the platform
Continue with KiwiBee
Choose the KiwiBee workspace or resource library that fits what you need next.
Related posts
Mastering ClassDojo: Smart Strategies for Engagement and Classroom Management
Go beyond the basics with advanced ClassDojo strategies including avatar customization as rewards, the Challenge Character concept for class-wide goals, and strategic attendance features that drive real behavior change.
ClassDojo for teachers: an honest 2026 guide
A teacher-to-teacher walkthrough of ClassDojo in 2026 — setup time, the dojo-points system, Class Story photo feed, free vs paid features, and honest scenarios where simpler free tools work better.
ClassDojo: My Top 5 Most Used Features
From the Random Student Selector to parent Chats, discover the five ClassDojo features teachers use most and how each one strengthens engagement, fairness, and communication in the classroom.
 For big organisations
 For schools
 For centers
 For team leaders
 For teachers
 AI and resources
 Printable worksheets
 Teacher tools
 AI studio
 Ideas and research