
Spin a spinner, flip a coin or roll a die and watch two sets of bars: the chances the shapes predict, and the results you actually got. Ten spins prove nothing; a few hundred and the two are hard to tell apart.
—
KiwiBee 使用 Google Analytics、Google Ads 和 Meta Pixel 的可选 Cookie,用于了解成年访客、统计已完成的注册并改进推广活动。必要 Cookie 始终保持开启。 OpenAI 的 ChatGPT 广告像素还会在您同意广告追踪后衡量页面浏览和已提交的咨询,并可能使用经过哈希处理的联系信息进行匹配。 隐私政策
KiwiBee’s classroom edition of Conway’s Game of Life makes each B3/S23 neighbor rule visible. Inspect a cell to see its neighbor count and predicted next state, compare stable blocks with repeating blinkers and moving gliders, undo a generation, or draw a starting pattern. Switch between a finite grid and wrapping edges to explore boundary assumptions. Inspired by Pedro Verruma’s MIT-licensed implementation; the cellular automaton was devised by John Conway. The new classroom engine models mathematical states, not living organisms.
Pedro Verruma; cellular automaton devised by John Conway. Original source license: MIT. Source: https://github.com/pmav/game-of-life. KiwiBee improves the classroom controls and experiments, retaining source credits and licenses.
This is a discrete mathematical model on a browser grid. The word life does not imply biological realism.
Use the activity controls inside the frame, or open fullscreen for a larger workspace. Ask students to predict a result, test it, and explain what changed. The embedded application starts in English; available upstream language controls are part of the original activity.
免费嵌入你的学习平台、博客或班级网站。
<iframe src="https://kiwibee.io/zh-cn/simulations/conway-game-of-life-simulation/embed" title="Conway’s Game of Life | KiwiBee" loading="lazy" allowfullscreen style="width:100%;height:min(70vh,620px);min-height:420px;border:0;border-radius:16px"></iframe>继续探索
Spin a spinner, flip a coin or roll a die and watch two sets of bars: the chances the shapes predict, and the results you actually got. Ten spins prove nothing; a few hundred and the two are hard to tell apart.

Type any function and see its shape straight away. Plot up to three at once in three colours to compare them, drag the trace point to read a value off a curve, and see where each one crosses zero.

Move m and watch the line tilt; move b and watch it slide. Or drag the two points on the line and read the equation it writes back. A rise-over-run staircase climbs the line so slope becomes something you can count.
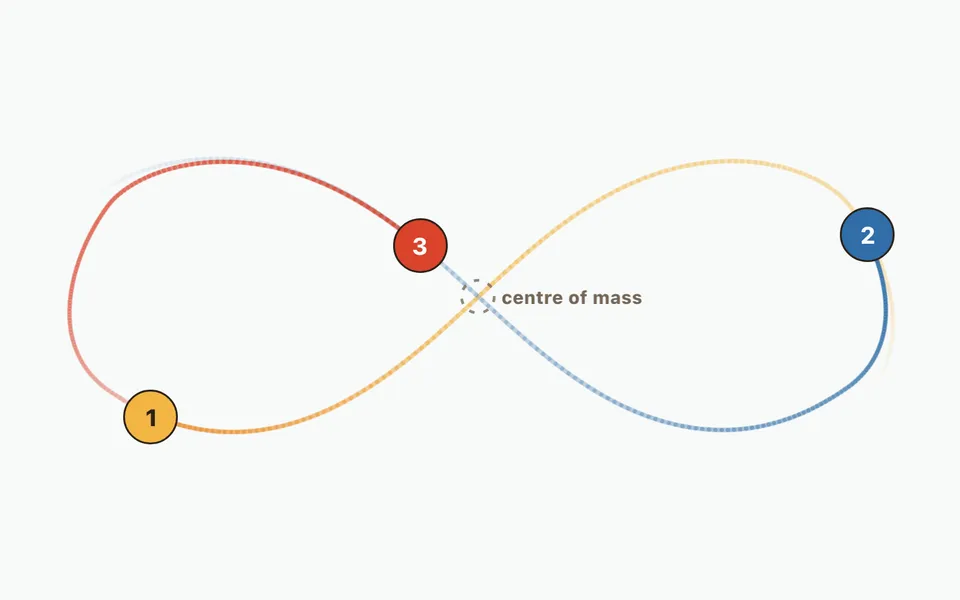
Compare a two-body orbit with three-body figure-eight motion, then add up to twelve bodies. Change initial masses, velocities and positions; watch orbit trails and numerical energy error.

Approximate the area under a curve with strips and choose how each takes its height: left edge, right edge, middle, or a sloping top. Push the strip count up and watch the error fall, with the running total plotted as its own curve.
从模型到记录
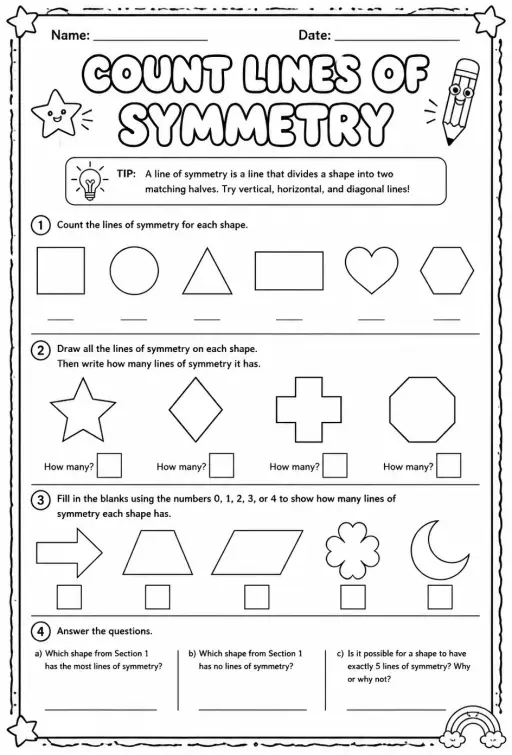
学生探索之后,用工作表记录他们的预测、观察和解释。
KiwiBee 的免费教师工作台把备课、工作表、课堂工具和成绩册集中在一处。
免费开始,创建你的第一个班级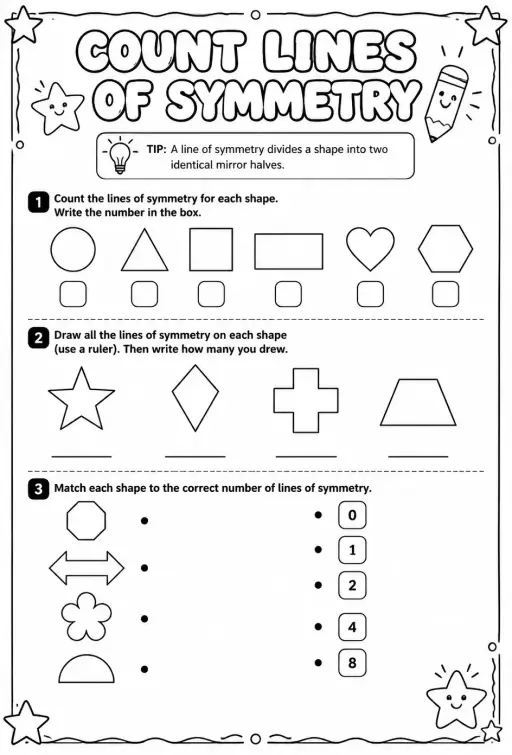
 首页
首页 全部解决方案
 价格
价格 关于我们
关于我们 KiwiBee 非营利组织计划
 活动与网络研讨会
 面向大型教育集团
 面向学校
面向学校 面向教育中心
 面向团队负责人
 面向教师
面向教师 AI 与教学资源
 教学资源
教学资源 可打印练习单
 课程包
课程包 互动模拟实验
 教师工具
教师工具 AI 工作室
 灵感与研究
灵感与研究