
Spin a spinner, flip a coin or roll a die and watch two sets of bars: the chances the shapes predict, and the results you actually got. Ten spins prove nothing; a few hundred and the two are hard to tell apart.
—
KiwiBee वयस्क विज़िटर्स को समझने, पूरे हुए साइन-अप मापने और अभियानों को बेहतर बनाने के लिए Google Analytics, Google Ads और Meta Pixel की वैकल्पिक कुकीज़ का उपयोग करता है। ज़रूरी कुकीज़ हमेशा चालू रहती हैं। OpenAI का ChatGPT Ads Pixel विज्ञापन की सहमति के बाद पेज व्यू और भेजी गई पूछताछ भी मापता है और मिलान के लिए हैश किए गए संपर्क विवरण का उपयोग कर सकता है। गोपनीयता नीति

Draw repeated samples from uniform, skewed or two-peaked populations. Compare the population histogram with the histogram of sample means.
Independent samples from bounded finite-variance populations. The normal overlay is a large-sample approximation; small samples retain population shape.
इसे अपने एलएमएस, ब्लॉग या कक्षा की वेबसाइट पर लगाएँ — मुफ़्त।
<iframe src="https://kiwibee.io/hi/simulations/central-limit-theorem-simulation/embed" title="Central Limit Theorem Lab | KiwiBee" loading="lazy" allowfullscreen style="width:100%;height:min(70vh,620px);min-height:420px;border:0;border-radius:16px"></iframe>खोज जारी रखें
Spin a spinner, flip a coin or roll a die and watch two sets of bars: the chances the shapes predict, and the results you actually got. Ten spins prove nothing; a few hundred and the two are hard to tell apart.

Type any function and see its shape straight away. Plot up to three at once in three colours to compare them, drag the trace point to read a value off a curve, and see where each one crosses zero.

Move m and watch the line tilt; move b and watch it slide. Or drag the two points on the line and read the equation it writes back. A rise-over-run staircase climbs the line so slope becomes something you can count.

Two bodies under gravity trace an ellipse forever and you can write the formula down. Add a third and no such formula exists. Run the figure-eight orbit, nudge one mass, and watch a stable pattern become unpredictable while the total energy stays put.

Approximate the area under a curve with strips and choose how each takes its height: left edge, right edge, middle, or a sloping top. Push the strip count up and watch the error fall, with the running total plotted as its own curve.
मॉडल से प्रमाण तक
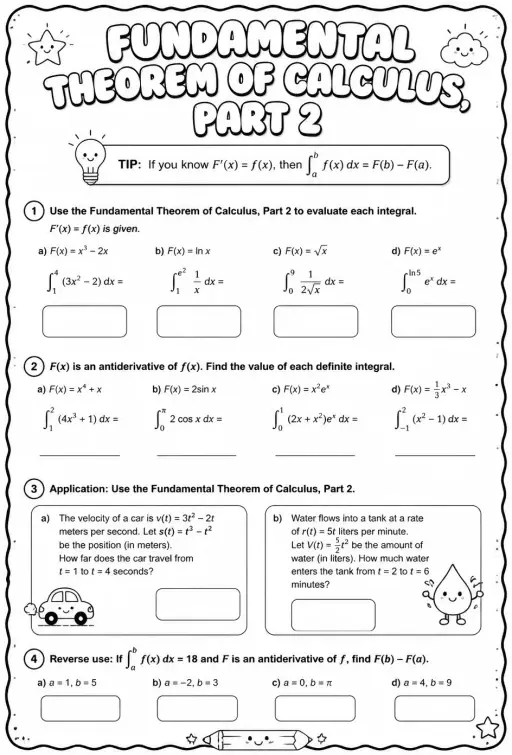
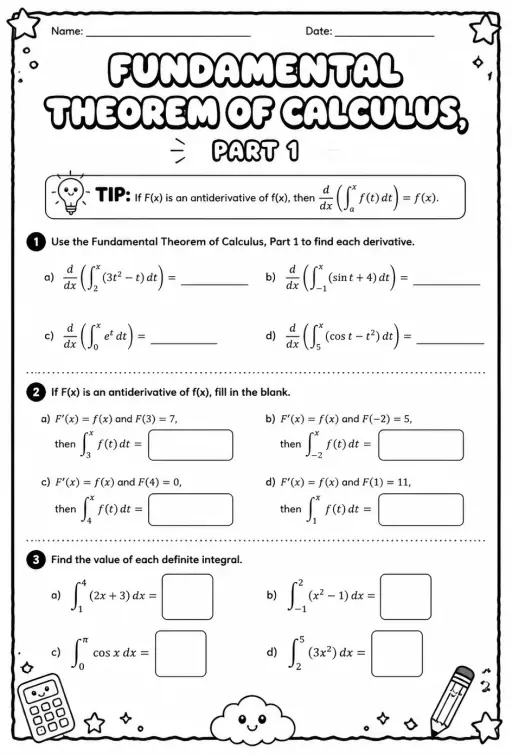
विद्यार्थियों के खोज लेने के बाद उनके अनुमान, प्रेक्षण और व्याख्याएँ दर्ज करने के लिए वर्कशीट का उपयोग करें।
KiwiBee का मुफ़्त शिक्षक कार्यक्षेत्र पाठ योजना, वर्कशीट, कक्षा उपकरण और ग्रेडबुक — सब एक ही जगह लाता है।
मुफ़्त शुरू करें और अपनी पहली कक्षा बनाएँ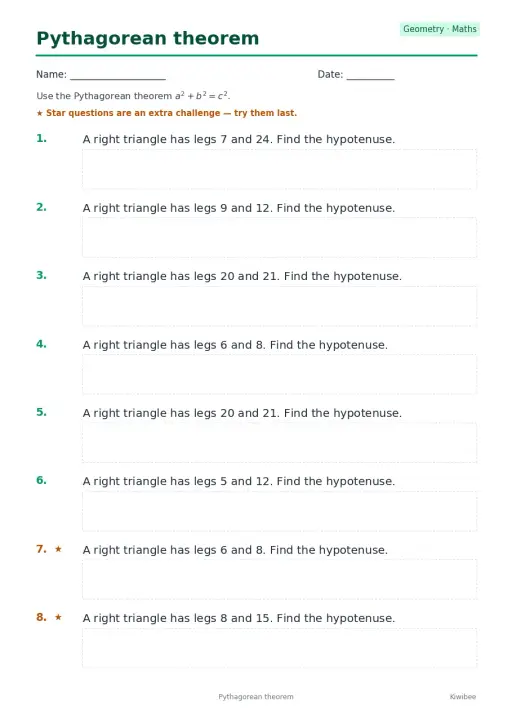
 होम
होम सभी समाधान
 कीमतें
 हमारे बारे में
 गैर-लाभकारी संस्थाओं के लिए KiwiBee
 कार्यक्रम और वेबिनार
 बड़े संगठनों के लिए
 स्कूलों के लिए
 लर्निंग सेंटरों के लिए
 टीम लीडरों के लिए
 शिक्षकों के लिए
 AI और संसाधन
 संसाधन
 प्रिंट करने योग्य वर्कशीट
 पाठ पैक
 इंटरैक्टिव सिमुलेशन
 शिक्षक उपकरण
 AI स्टूडियो
 विचार और शोध