
Periodic Table 3D
- Chemistry
Comments
Related to this simulation
Picked by meaning from games, worksheets, simulations, teacher tools and videos.
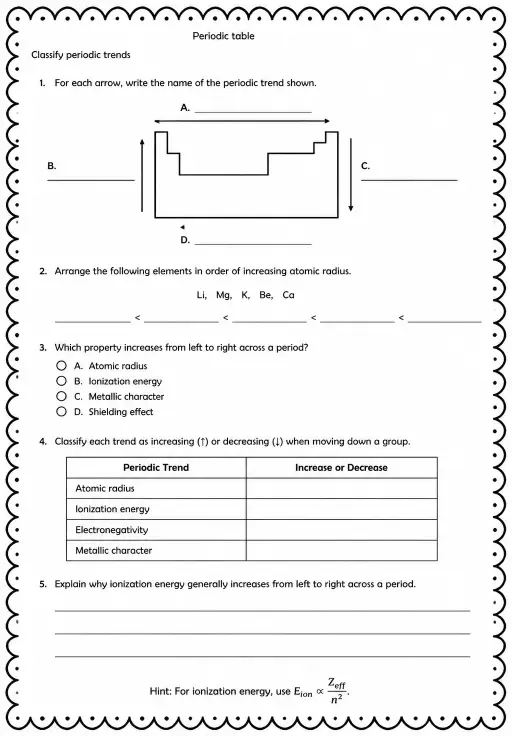
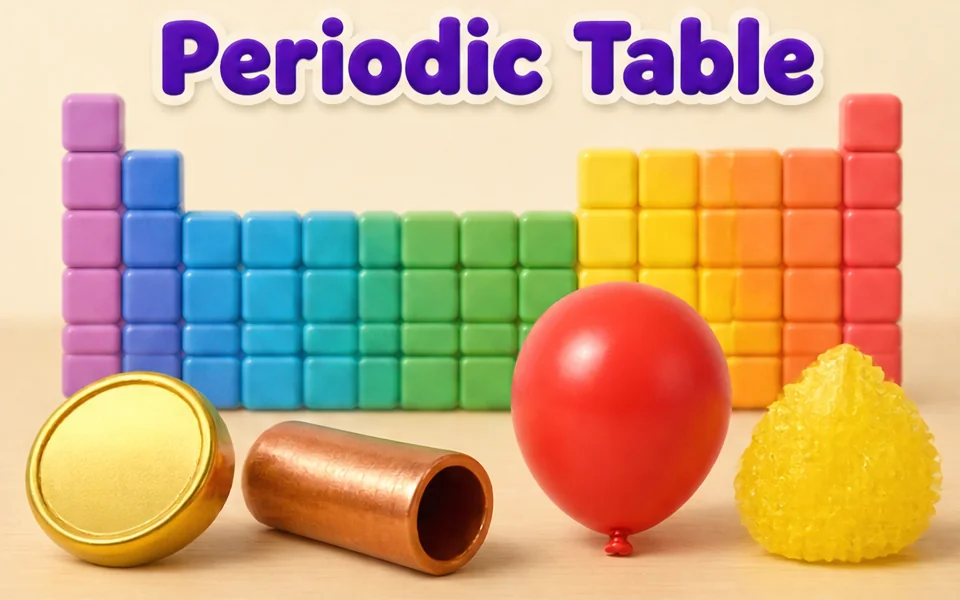
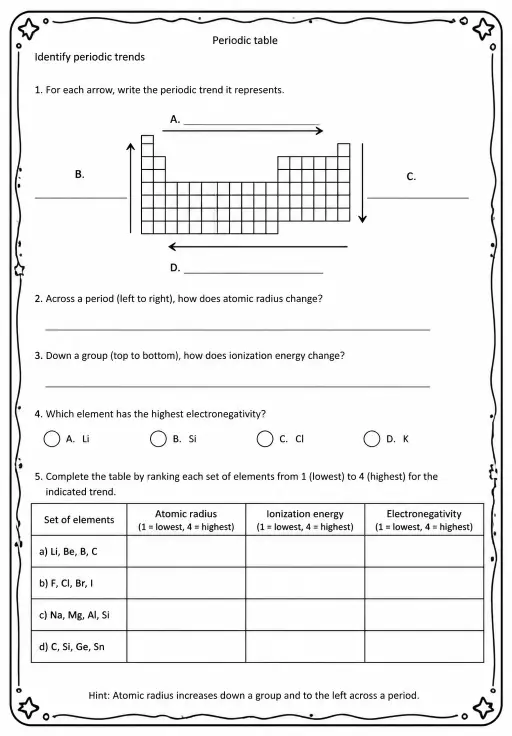
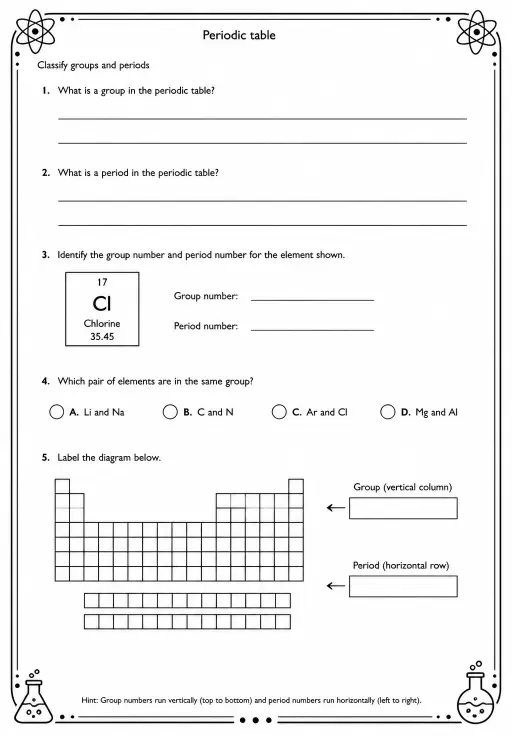

About this simulation
This simulation turns the periodic table for elements 1 to 86 into 3D towers, one per element, in the usual 18 group layout with the lanthanides in a row below. Tower height shows either electronegativity on the Pauling scale or first ionisation energy in electronvolts. A moving highlight cycles through the elements, and readouts give the highlighted element, its value and its rank. Teachers can use it to show periodic trends: the values rise toward the top right and fall down each group, with noble gases having no electronegativity value.
What students can explore
- Select Electronegativity and find the tallest tower, then read the Highlighted and Value readouts.
- Switch Property to First ionisation energy and compare helium with the alkali metals.
- Look down one group and describe how the tower heights change.
- Look across period 3 and describe the trend from sodium to chlorine.
- Slow the Highlight speed so students can read each element's Value and Rank.
Learning objectives
- 1Describe how electronegativity changes across a period and down a group.
- 2Describe the trend in first ionisation energy across the table.
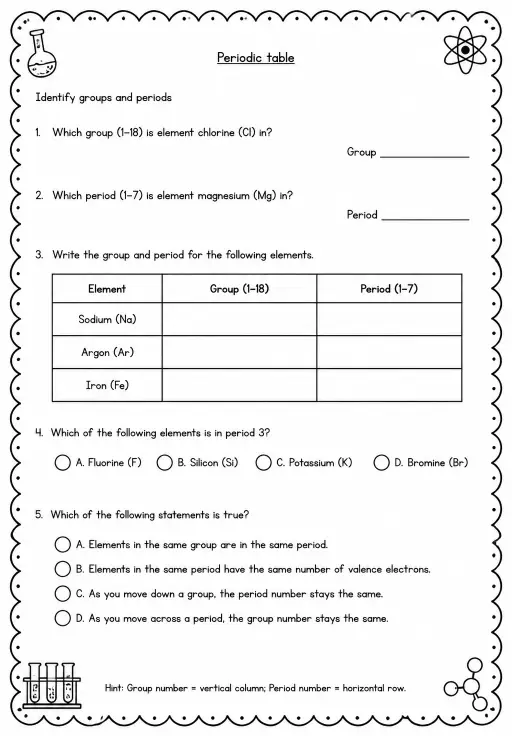
- 3Locate elements by group and period in the periodic table layout.
- 4Use a 3D height display to compare property values between elements.
Questions teachers ask
Is it free?
Yes. It is free, runs in any modern browser including on interactive whiteboards and tablets, and needs no sign-up.
What is electronegativity?
Electronegativity measures how strongly an atom attracts the shared electrons in a bond. It is shown here on the Pauling scale, where fluorine is the highest. Noble gases like helium, neon and argon have no value in this scale.
Why does ionisation energy fall down a group?
Atoms lower in a group have outer electrons further from the nucleus and more shielding from inner electrons, so the outer electron is easier to remove.
How do I use it in class?
Choose a Property from the drop-down and set the Highlight speed. Drag to rotate the table and read the highlighted element, its value and rank. Ask students to describe the trend they see.
Embed this simulation
Drop it into your LMS, blog, or class site — free.
<iframe src="https://kiwibee.io/en/simulations/periodic-table-3d-3d-simulation/embed" title="Periodic Table 3D | KiwiBee" loading="lazy" allowfullscreen style="width:100%;height:min(70vh,620px);min-height:420px;border:0;border-radius:16px"></iframe>Curriculum standards
Cambridge
- 9Cm.01Understand that the structure of the Periodic Table is related to the atomic structure of the elements and the Periodic Table can be used to predict an element’s structure and properties.Cambridge Lower Secondary Science (0893) — Stage 9 › Chemistry › Materials and their structure
- 9Cp.01Understand that the groups within the Periodic Table have trends in physical and chemical properties, using group 1 as an example.Cambridge Lower Secondary Science (0893) — Stage 9 › Chemistry › Properties of materials
Learning objectives © UCLES (Cambridge University Press & Assessment), quoted with attribution.
Bring interactive science into your classroom
KiwiBee's free teacher workspace brings lesson planning, worksheets, classroom tools, and gradebook together in one place.
Start free and create your first classWatch KiwiBee on YouTube
Short KiwiBee videos for teachers and schools. Subscribe, or follow KiwiBee wherever you are.
 Home
 All solutions
 Pricing
 About us
 KiwiBee for Non-profits
 Events & webinars
 For big organisations
 For schools
 For centers
 For team leaders
 For teachers
 Resources
 Printable worksheets
 Interactive simulations
 Teacher tools
 Ideas and research


