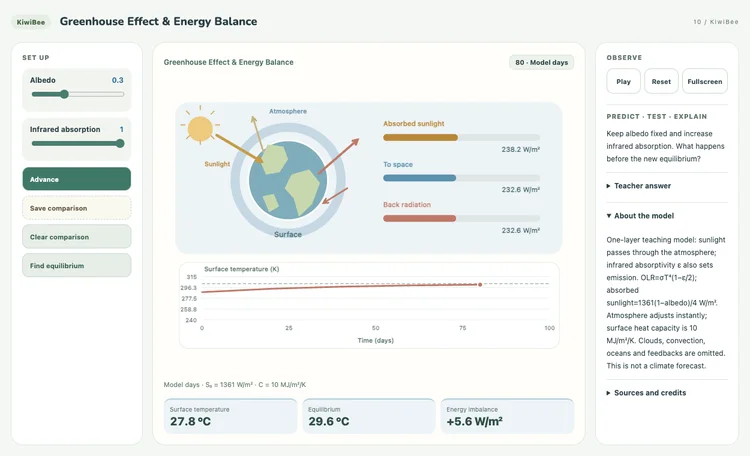
Explore Earth’s incoming sunlight and outgoing infrared radiation. Change albedo and atmospheric absorption, then watch the surface warm or cool.
—
KiwiBee uses optional Google Analytics, Google Ads, and Meta Pixel cookies to understand adult visitors, measure completed sign-ups, and improve campaigns. Essential cookies always stay on. OpenAI’s ChatGPT Ads Pixel also measures page views and completed enquiries after advertising consent, and may use hashed contact details for matching. Privacy policy
This model shows how greenhouse gases warm a planet. Yellow dots of sunlight pass through the air and warm the ground, which sends heat back out as red infrared dots, and CO2 molecules absorb some of it and send about half back down. Students set CO2 from 150 to 1200 ppm, change sunlight from 0.9 to 1.1 times, turn water-vapor feedback on or off and hide the infrared. Readouts give CO2 in air, surface temperature, added heat trapping and energy imbalance. It supports lessons on the greenhouse effect and the link between CO2 and climate.
Yes. It is free in any modern browser, including whiteboards and tablets. There is no sign-up and nothing to install.
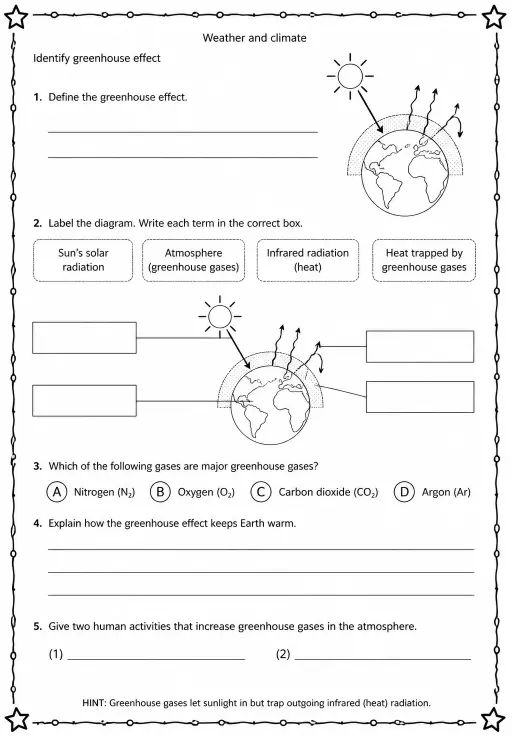
Sunlight warms the ground, which radiates infrared heat. Gases like CO2 and water vapor absorb that infrared and re-emit part of it downward, keeping Earth about 33 C warmer than it would otherwise be.
Drag the CO2 slider upward and watch the Surface temperature and Added heat trapping readouts. More red infrared dots are sent back down and the surface warms until balance returns.
No. The molecules are far bigger and denser than in reality, and the absorption chance is tuned to show the idea. The temperatures use the standard logarithmic CO2 forcing formula.
Drop it into your LMS, blog, or class site — free.
<iframe src="https://kiwibee.io/en/simulations/greenhouse-effect-3d-simulation/embed" title="Greenhouse Effect | KiwiBee" loading="lazy" allowfullscreen style="width:100%;height:min(70vh,620px);min-height:420px;border:0;border-radius:16px"></iframe>Continue exploring
Explore Earth’s incoming sunlight and outgoing infrared radiation. Change albedo and atmospheric absorption, then watch the surface warm or cool.
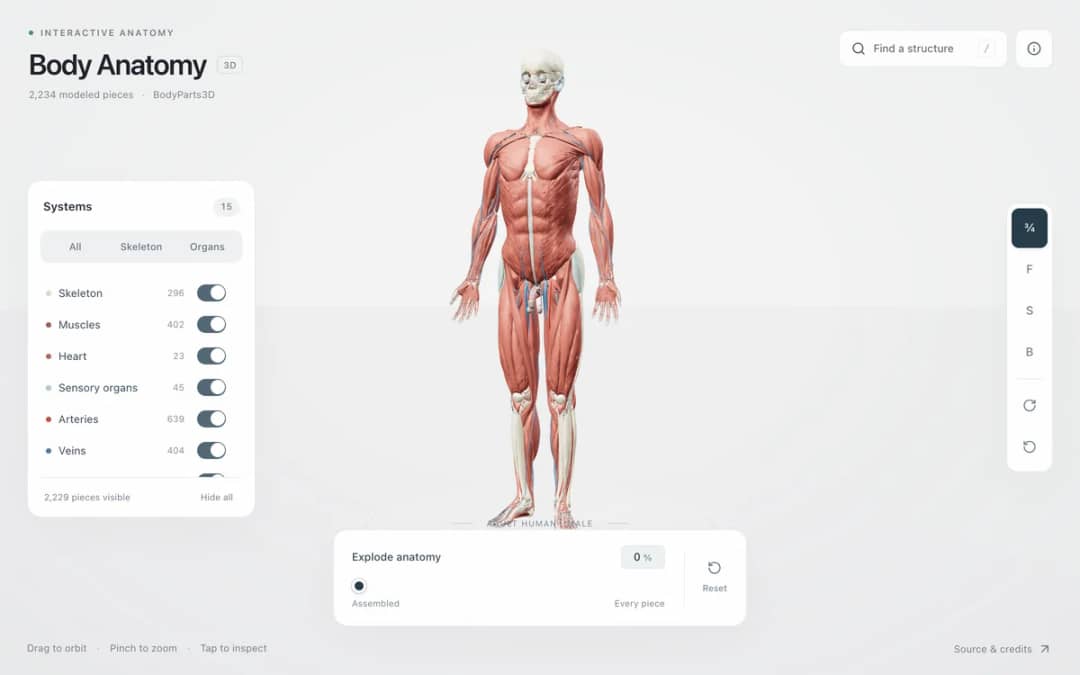
Explore an adult male reference body in 3D. Reveal 14 anatomical systems, search thousands of named structures, isolate organs, and pull 2,209 modeled pieces apart to see how the body is organized.
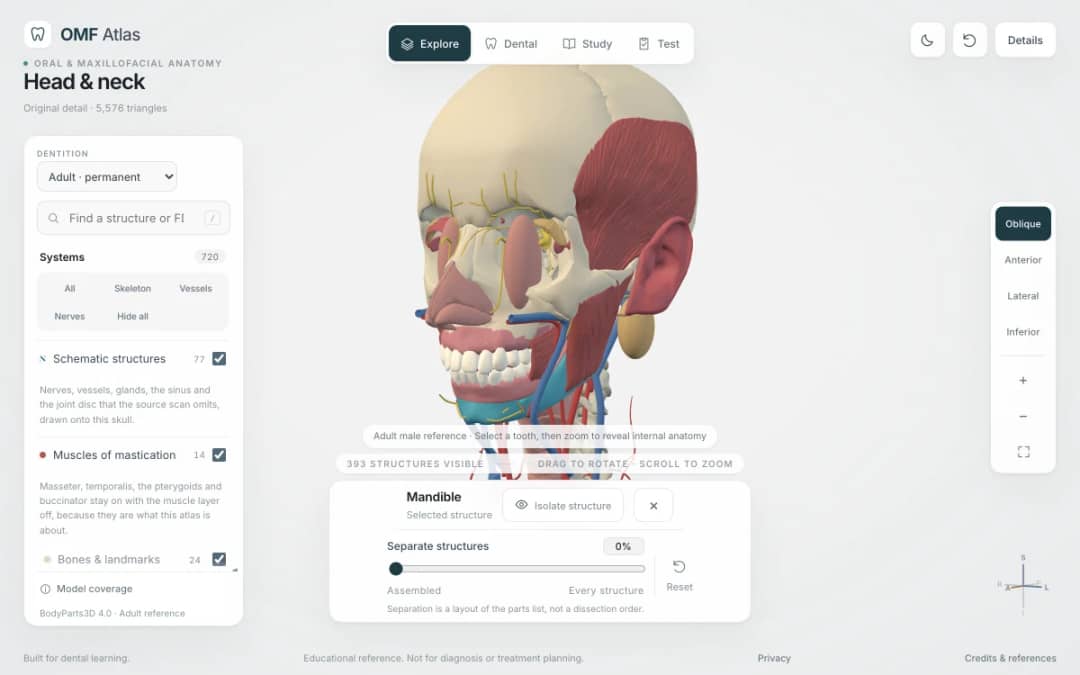
Explore the head and neck in 3D: 643 source meshes across 14 layers, 47 facial and masticatory muscles, and 77 drawn nerves, vessels and glands the source scan omits. Open any tooth onto its own pulp canal, and follow the seven stages of tooth development.

Free interactive photosynthesis simulation. Explore photosynthesis hands-on online — great for whole-class or independent practice.

Free interactive states of matter simulation. Explore states of matter hands-on online — great for whole-class or independent practice.
From model to evidence
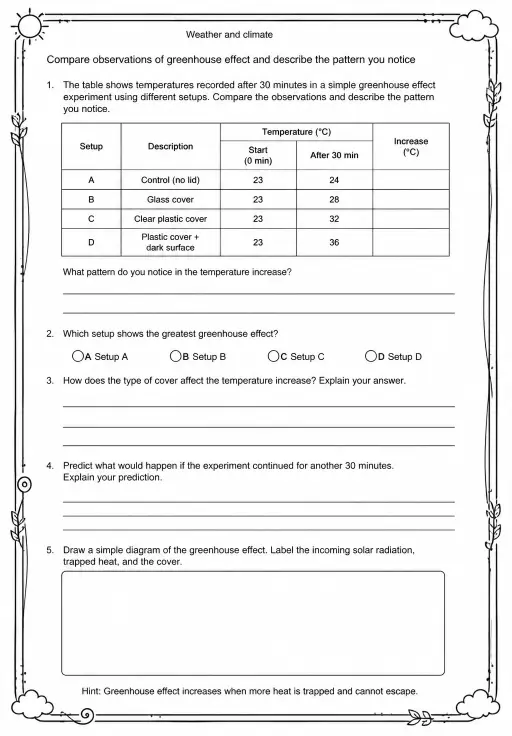
Use a worksheet to capture predictions, observations, and explanations after students explore.
KiwiBee's free teacher workspace brings lesson planning, worksheets, classroom tools, and gradebook together in one place.
Start free and create your first class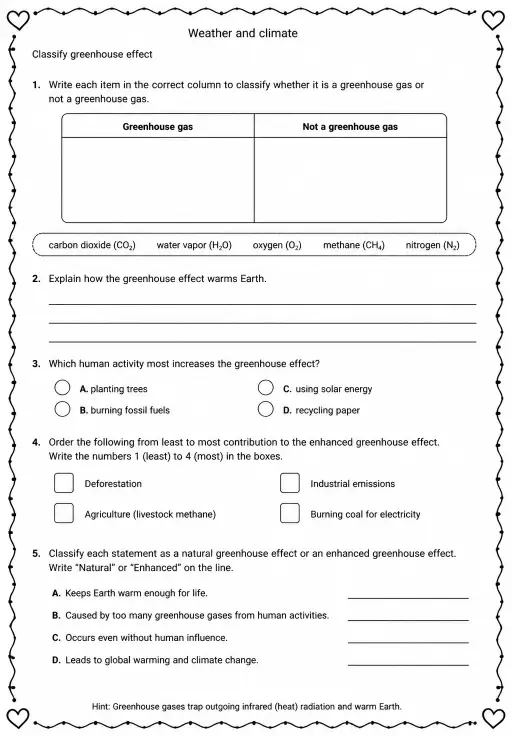
 Home
 All solutions
 Pricing
 About us
 KiwiBee for Non-profits
 Events & webinars
 For big organisations
 For schools
 For centers
 For team leaders
 For teachers
 AI and resources
 Resources
 Printable worksheets
 Lesson Packs
 Interactive simulations
 Teacher tools
 AI studio
 Ideas and research