
PPTX · 10 slides
Line Plots: Grade 2 Math Presentation
MathGrade 2English
Slide 1 of 10
More like this presentation
Picked by meaning from games, worksheets, simulations, teacher tools and videos.



About this presentation
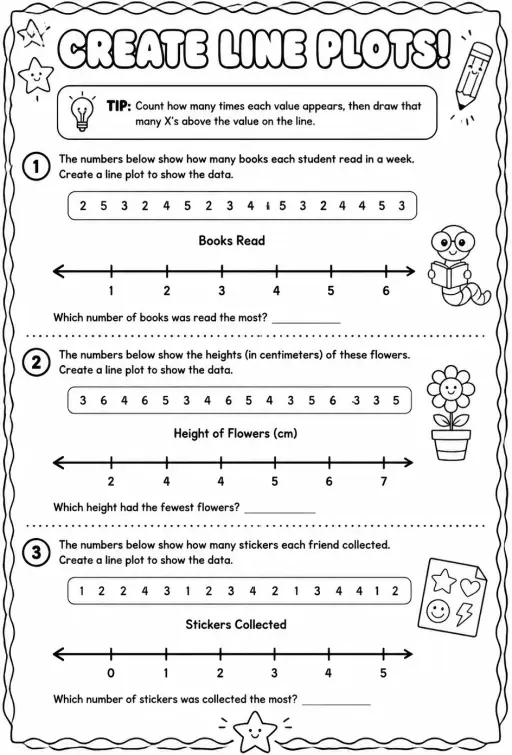
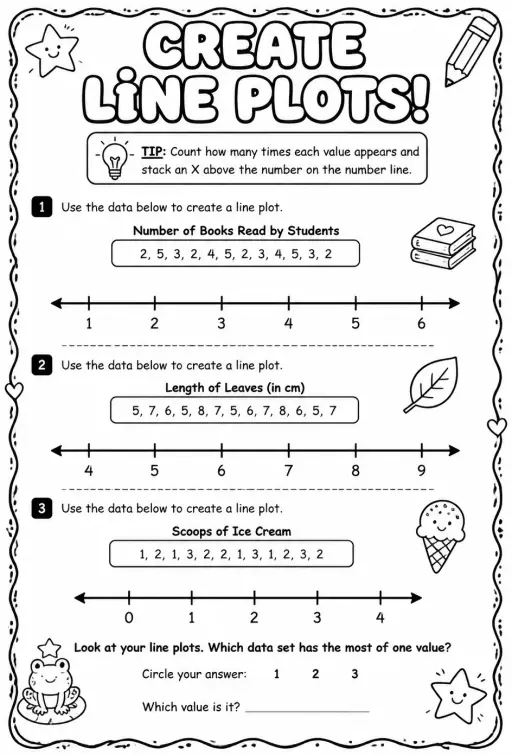
Pupils learn to make a line plot from measurements and read how many and which length. The 23 slides include worked examples, your-turn practice and a 7-question quiz with answers.
Curriculum standards
IXL
- IXL.MATH.G2.FF.11Create line plotsIXL Math — Grade 2 › Tally charts, graphs, and line plots
- IXL.MATH.G2.FF.12Interpret line plotsIXL Math — Grade 2 › Tally charts, graphs, and line plots
Skill lists aligned to IXL Learning skill plans, carried over from KiwiBee's System presets; the Maths section names are KiwiBee's own. IXL is a trademark of IXL Learning; no endorsement is implied.
Likes & comments
See what other teachers think and share a helpful note.
Loading likes and comments…
Worksheet Studio
Make a worksheetFollow the slides with a matching worksheet
Make a printable on the same topic for any age and language. Free.
 Home
 All solutions
 Pricing
 About us
 KiwiBee for Non-profits
 Events & webinars
 For big organisations
 For schools
 For centers
 For team leaders
 For teachers
 Resources
 Printable worksheets
 Interactive simulations
 Teacher tools
 Ideas and research


