KiwiBee printable
Rate of change of a linear function: tables
Free printable Algebra 1 math worksheet for "Rate of change of a linear function: tables" — practice linear functions. No-prep, print or assign online.
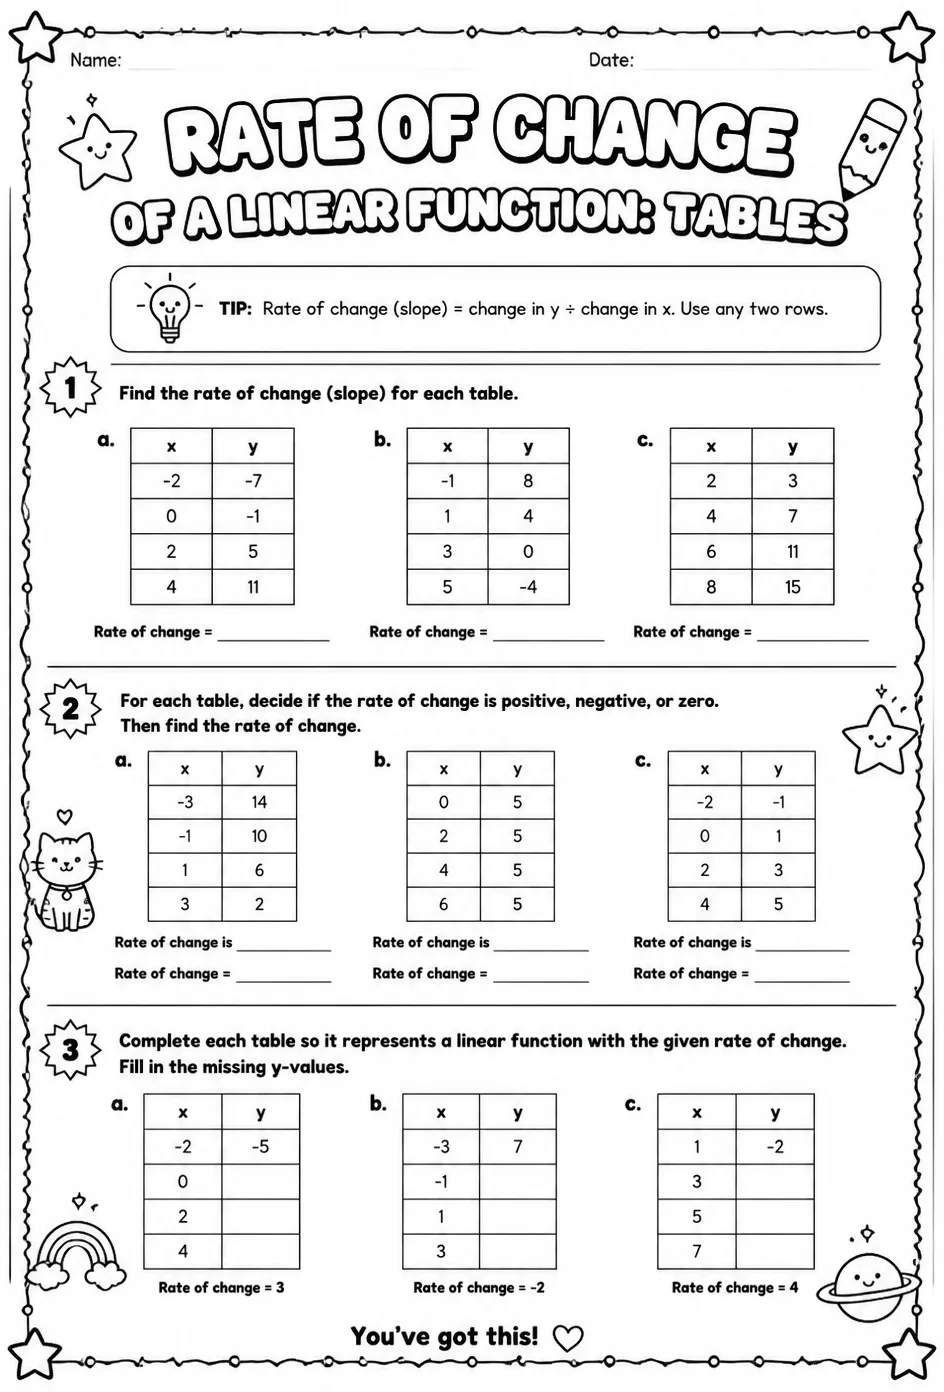
This worksheet provides practice in analyzing tables to find the rate of change for linear functions, reinforcing students' understanding of slope in a tabular format. Teachers can use it to assess and strengthen students' ability to identify linear relationships and interpret rates of change in various contexts. Ideal for Algebra 1 classes focusing on linear functions and their properties.
Learning objectives
- Calculate the rate of change from a table of values representing a linear function
- Interpret the meaning of the rate of change in the context of real-world problems
- Determine whether a function is linear based on its rate of change across a table
How to use this worksheet
- Click “Download Worksheet” and sign in with Google or email to get the PDF instantly.
- Print at home or in class for High School; it's no-prep, with no extra materials needed.
- Hand it out as classwork, homework, or a quick warm-up.
Likes & comments
See what other teachers think and share a helpful note.
Loading likes and comments…
Create more worksheets in our Worksheet Studio
Generate fresh worksheets for any grade, topic, and language — free.
Open the Worksheet StudioRelated worksheets
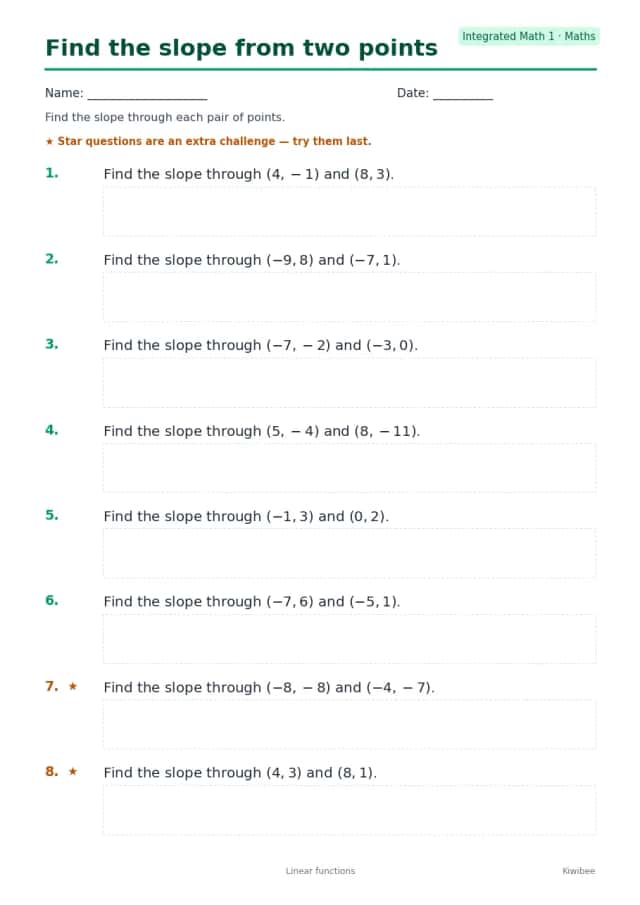
Find the slope from two points
Worksheets
medium
Ages 14–18
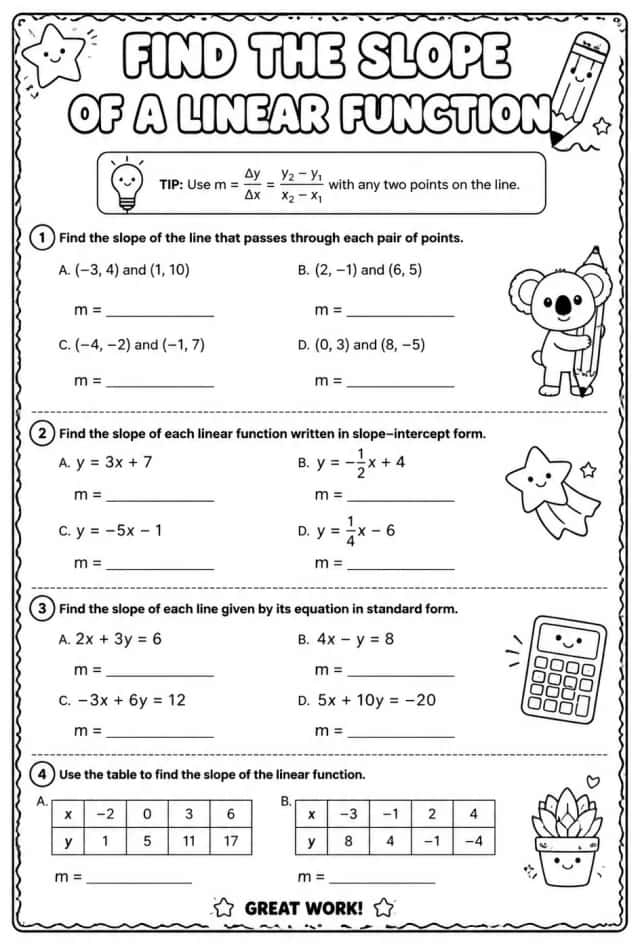
Find the slope of a linear function
Worksheets
hard
Ages 14–18
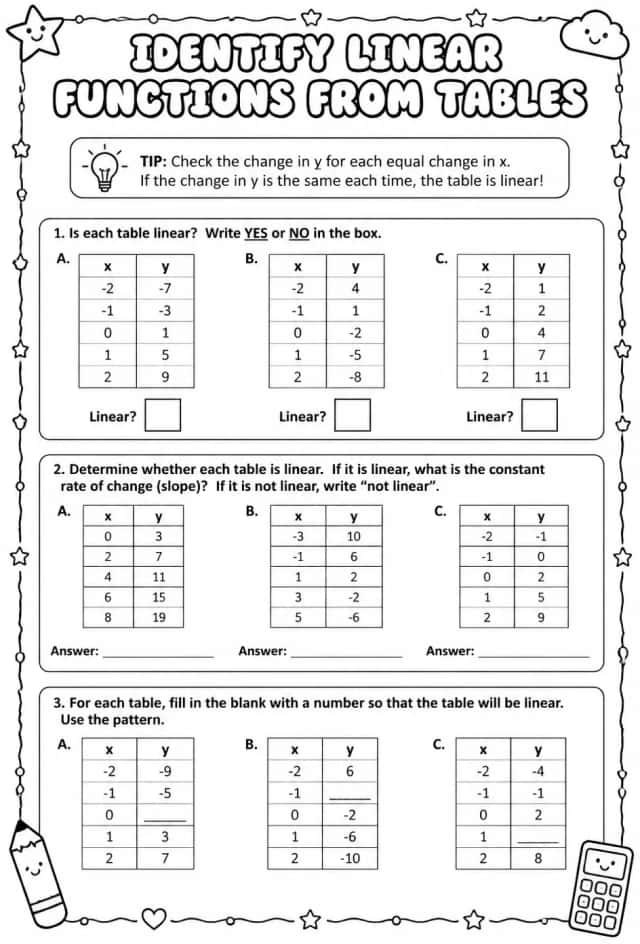
Identify linear functions from tables
Worksheets
hard
Ages 14–18
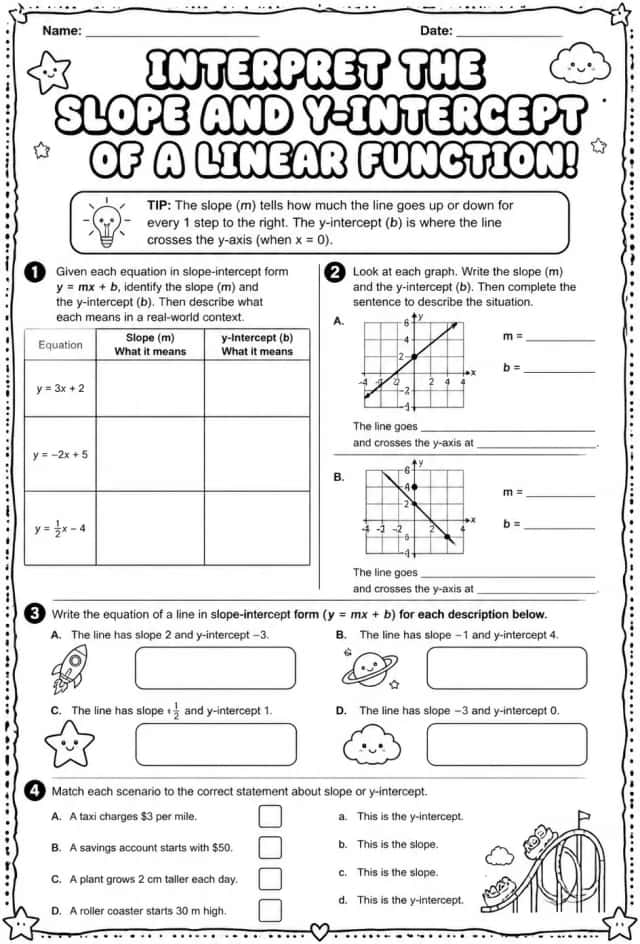
Interpret the slope and y-intercept of a linear function
Worksheets
hard
Ages 14–18
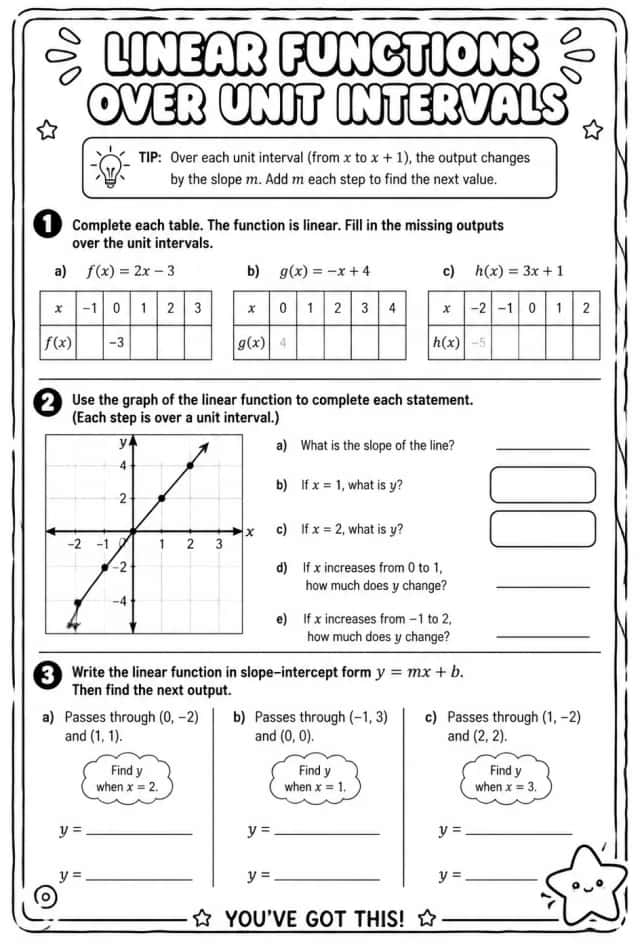
Linear functions over unit intervals
Worksheets
hard
Ages 14–18
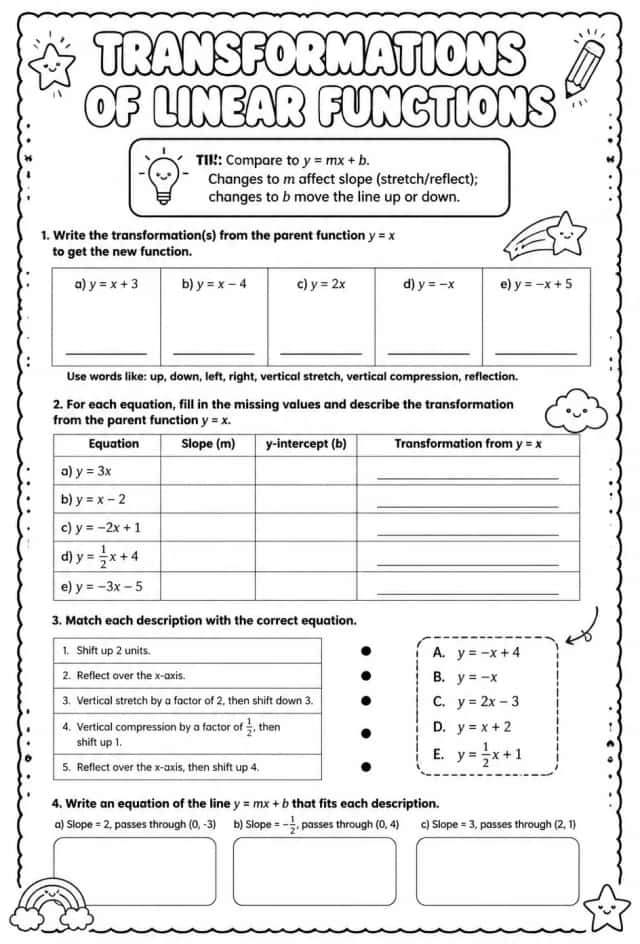
Transformations of linear functions
Worksheets
hard
Ages 14–18
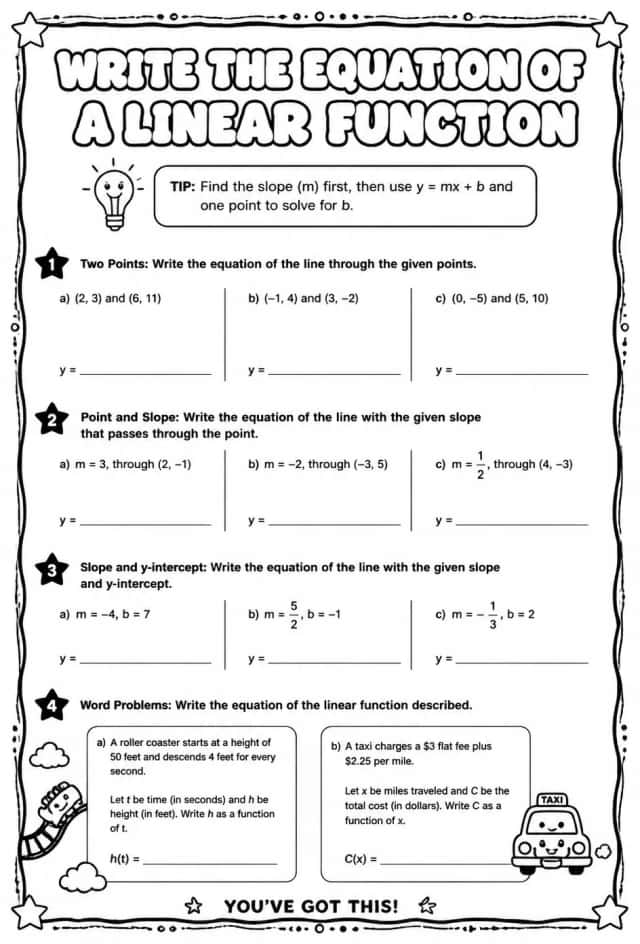
Write the equation of a linear function
Worksheets
hard
Ages 14–18
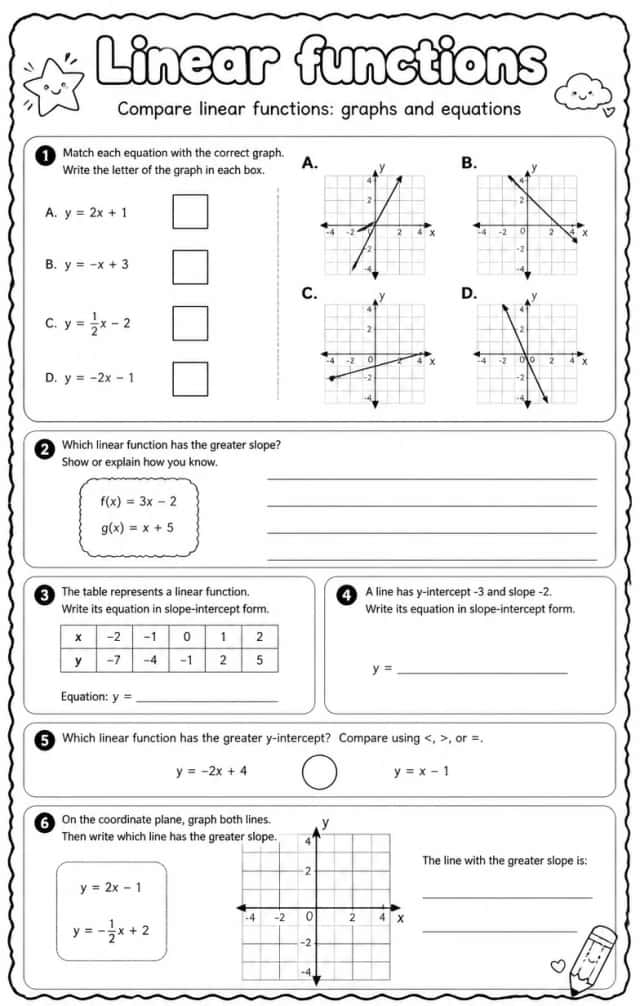
Compare linear functions: graphs and equations
Worksheets
hard
Ages 14–18