KiwiBee printable
Rate of change of a linear function: graphs
Free printable Algebra 1 math worksheet for "Rate of change of a linear function: graphs" — practice linear functions. No-prep, print or assign online.
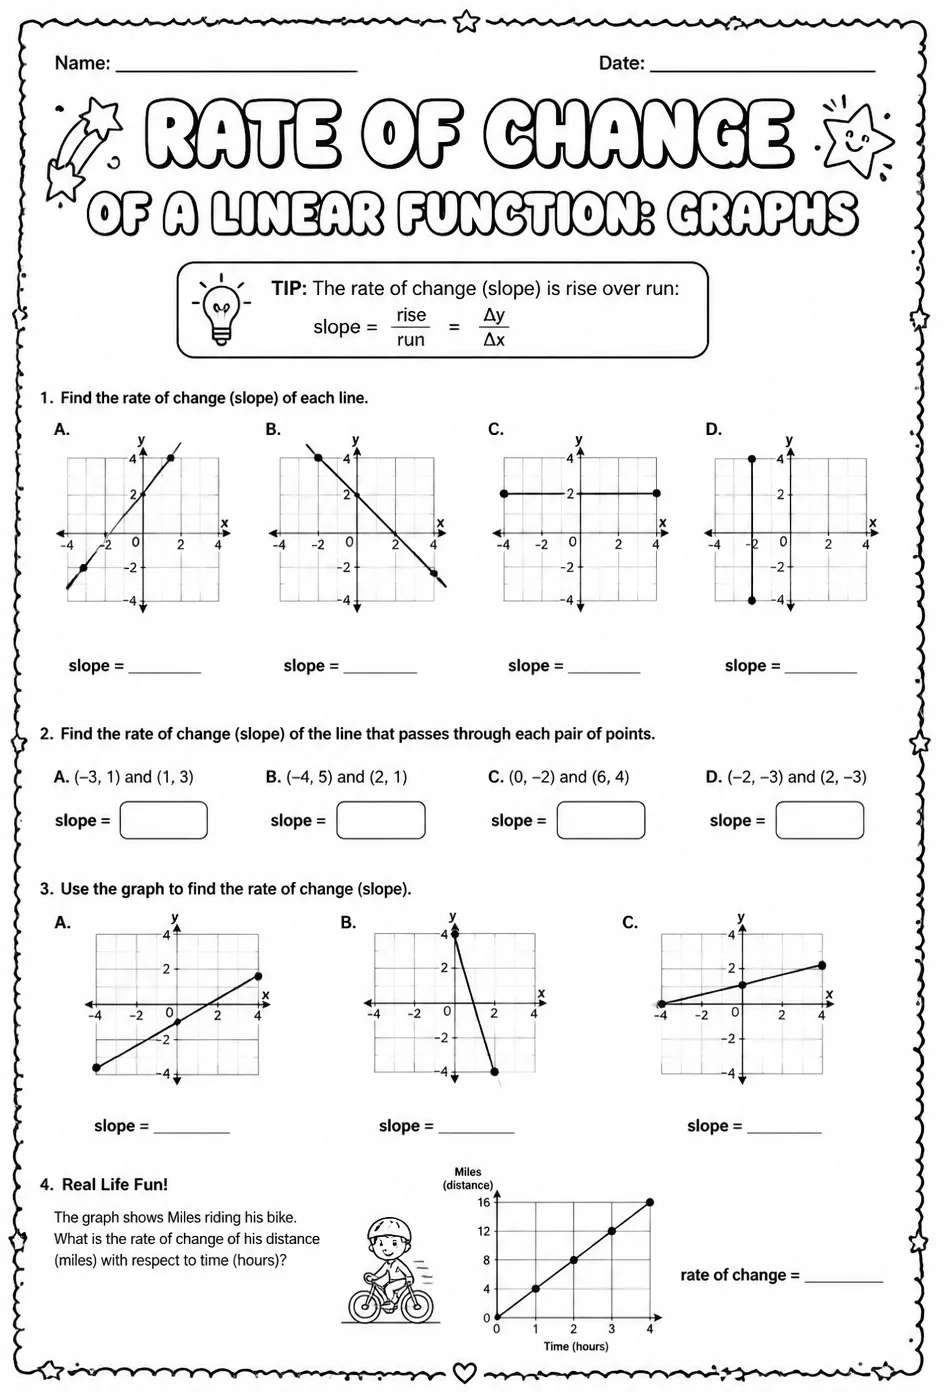
This worksheet focuses on understanding and calculating the rate of change in linear functions through graph analysis. Teachers can use it to reinforce students' ability to identify slope visually and numerically, deepening their grasp of linear relationships. Ideal for Algebra 1 classes, the exercises challenge students to connect graphical representations with algebraic concepts of rate of change.
Learning objectives
- Interpret the rate of change from the graph of a linear function.
- Calculate the slope of a line using two points on the graph.
- Analyze how changes in the graph affect the rate of change of the linear function.
How to use this worksheet
- Click “Download Worksheet” and sign in with Google or email to get the PDF instantly.
- Print at home or in class for High School; it's no-prep, with no extra materials needed.
- Hand it out as classwork, homework, or a quick warm-up.
Likes & comments
See what other teachers think and share a helpful note.
Loading likes and comments…
Create more worksheets in our Worksheet Studio
Generate fresh worksheets for any grade, topic, and language — free.
Open the Worksheet StudioRelated worksheets
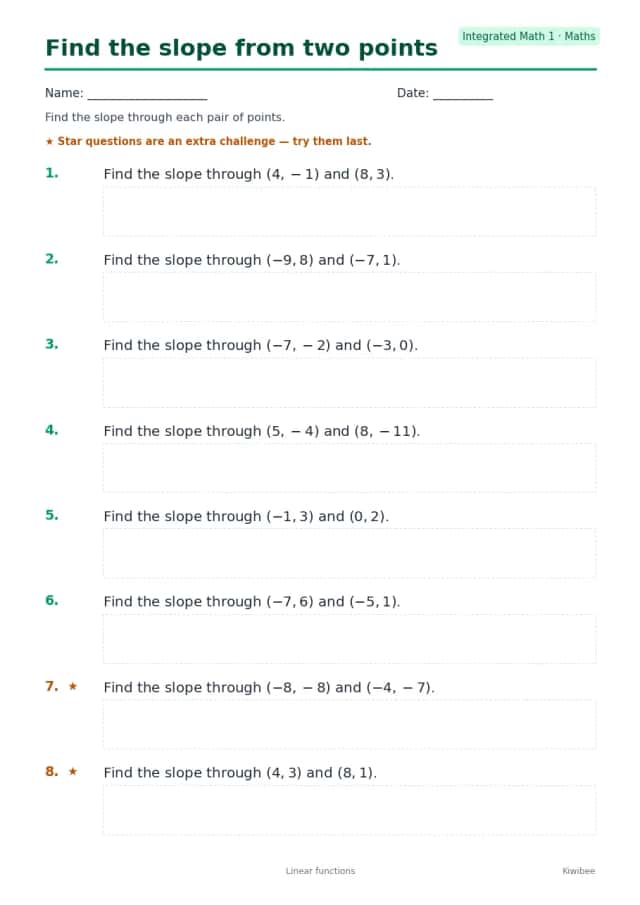
Find the slope from two points
Worksheets
medium
Ages 14–18
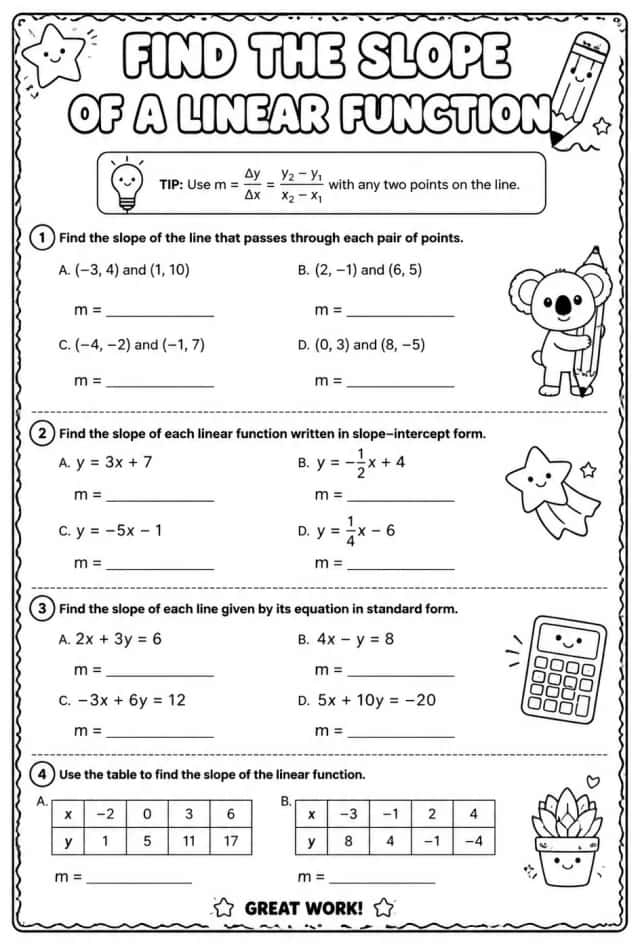
Find the slope of a linear function
Worksheets
hard
Ages 14–18
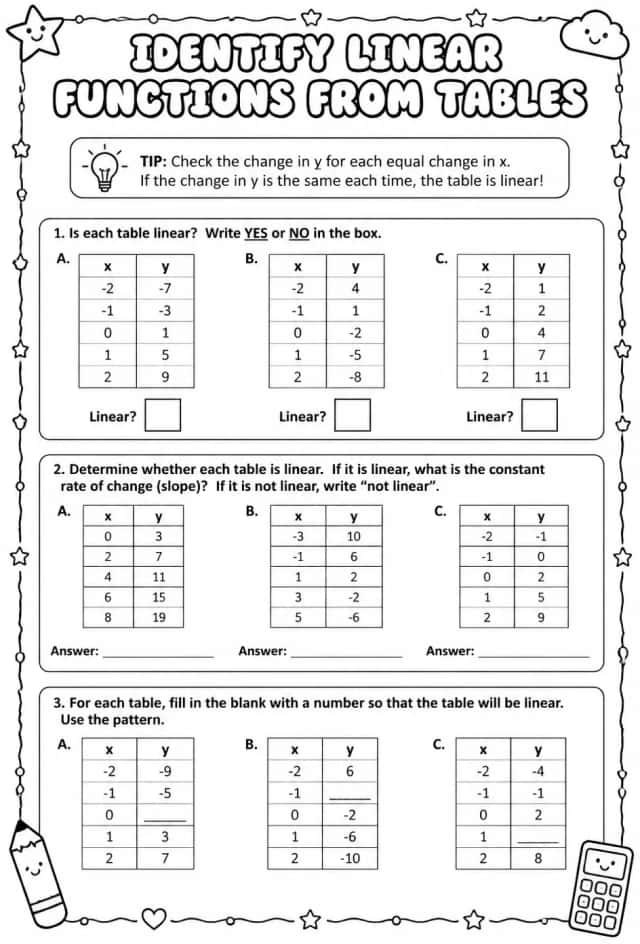
Identify linear functions from tables
Worksheets
hard
Ages 14–18
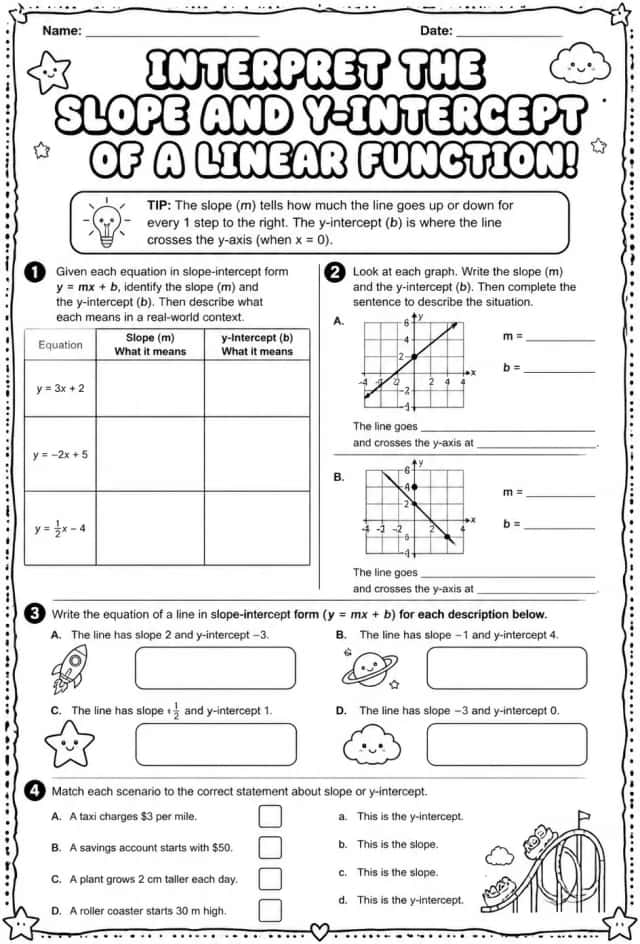
Interpret the slope and y-intercept of a linear function
Worksheets
hard
Ages 14–18
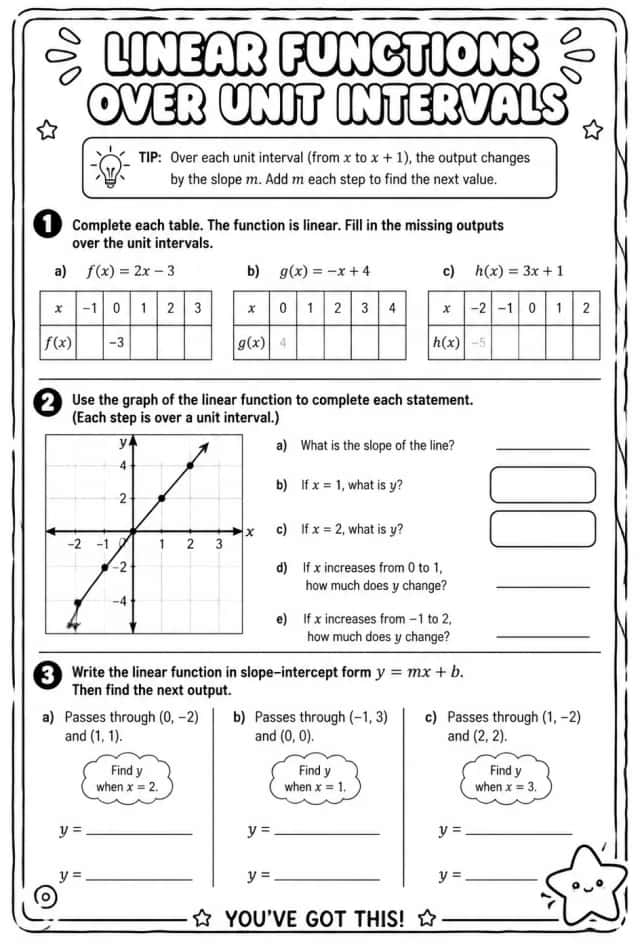
Linear functions over unit intervals
Worksheets
hard
Ages 14–18
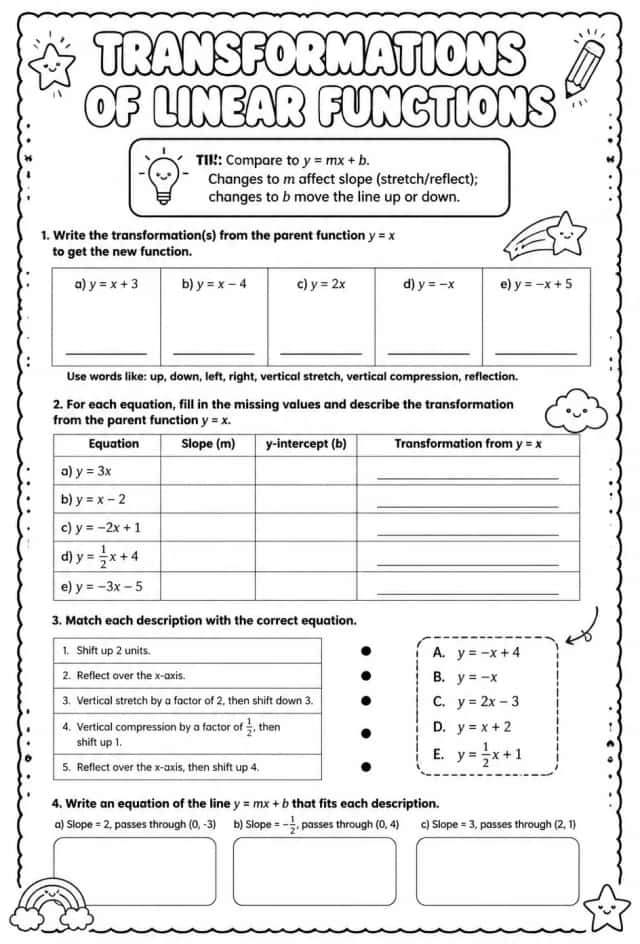
Transformations of linear functions
Worksheets
hard
Ages 14–18
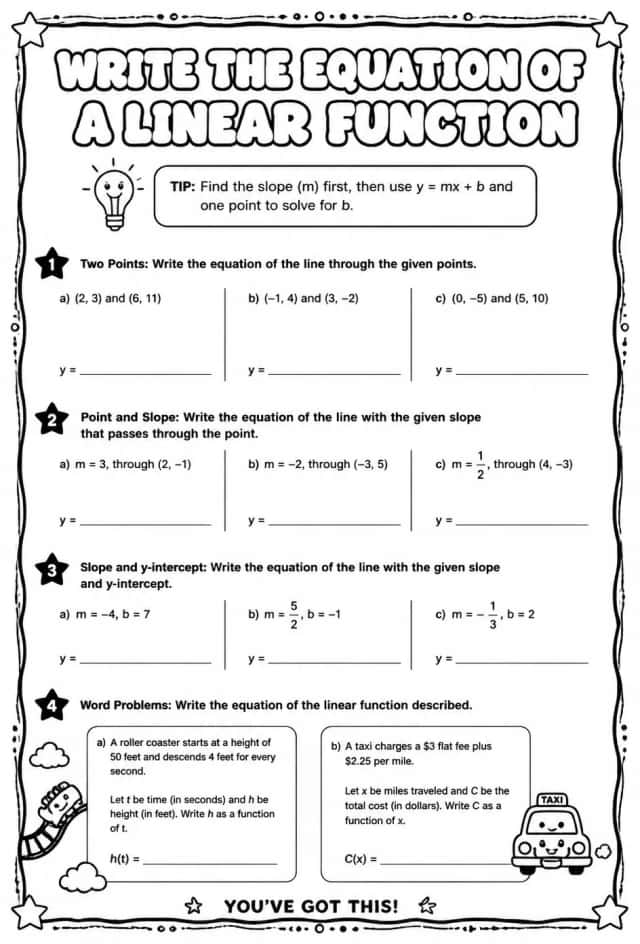
Write the equation of a linear function
Worksheets
hard
Ages 14–18
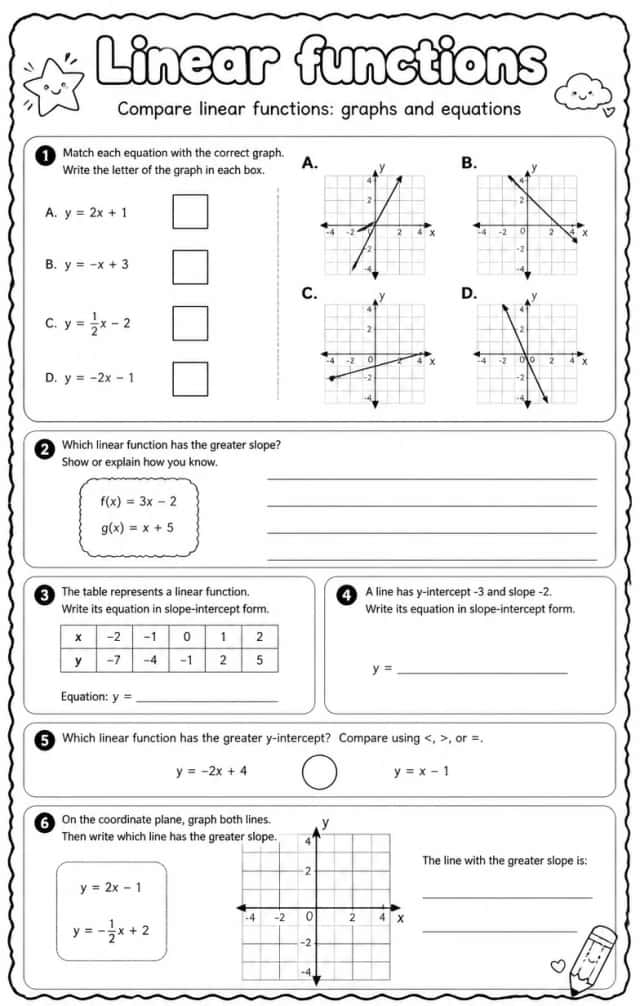
Compare linear functions: graphs and equations
Worksheets
hard
Ages 14–18