KiwiBee printable
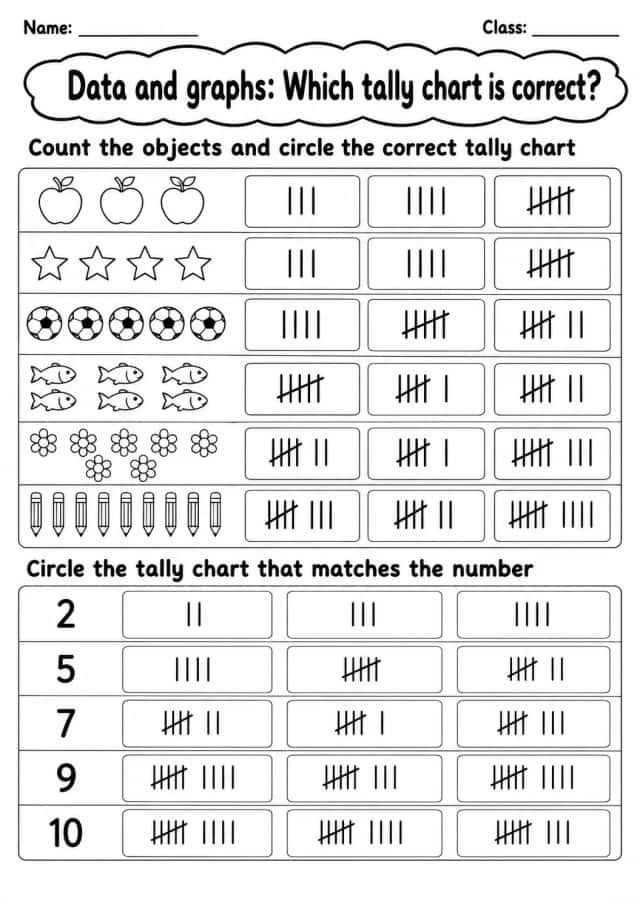
Interpret tally charts
Free printable Grade 2 math worksheet for "Interpret tally charts" — practice data and graphs. No-prep, print or assign online.
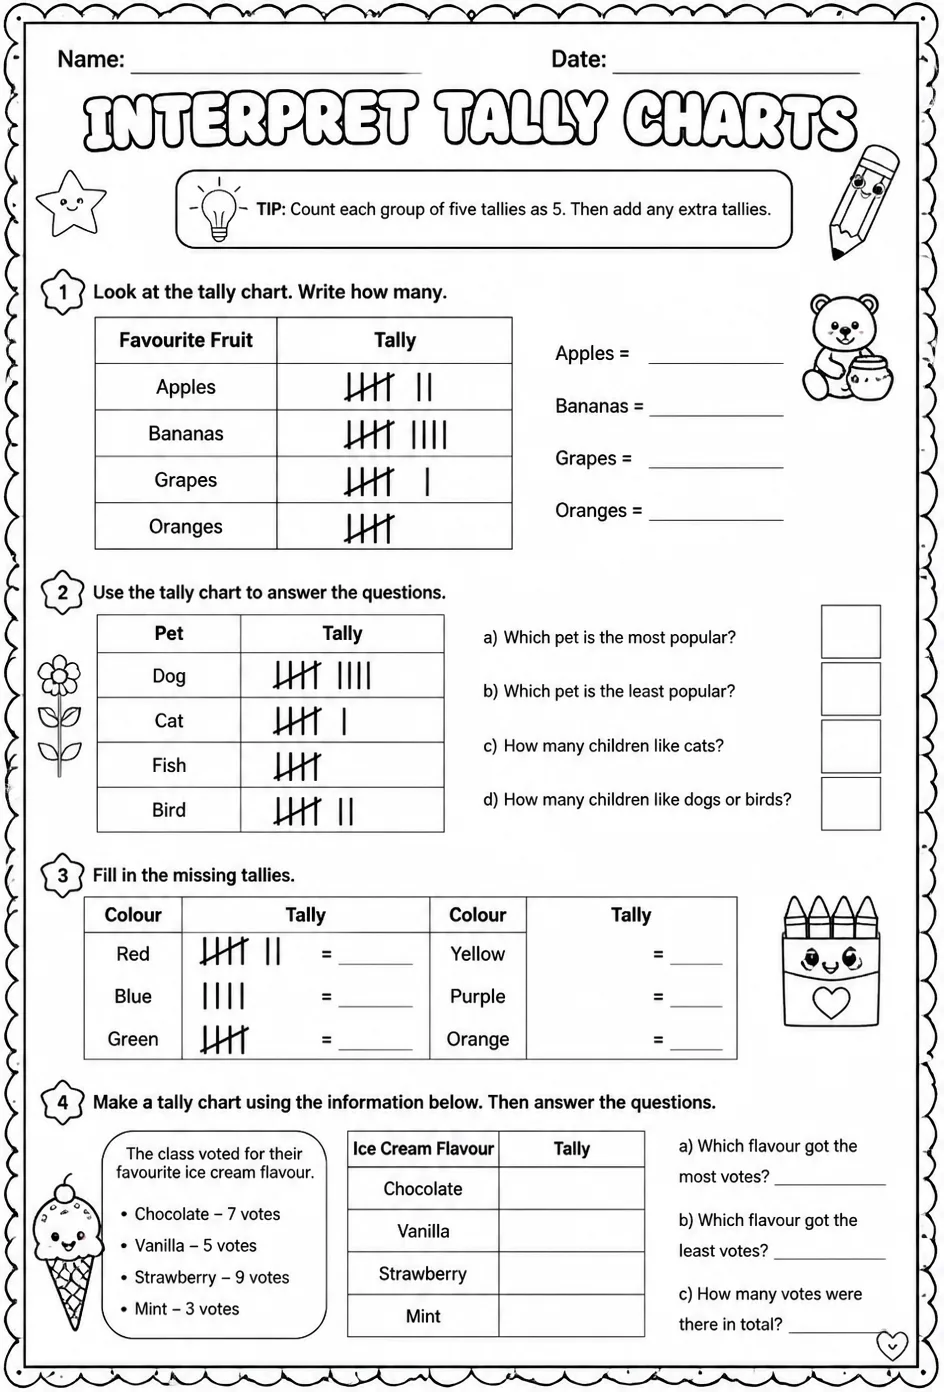
This worksheet helps Grade 2 students develop skills in interpreting tally charts within the topic of data and graphs. Teachers can use this resource to reinforce students' ability to read and analyze tally marks, enhancing their understanding of organizing and representing data visually. The exercises include both reading existing tally charts and creating new ones, supporting medium-level practice in data interpretation.
Learning objectives
- Read and interpret data presented in tally charts
- Answer questions based on information from tally charts
- Create simple tally charts from given data sets
How to use this worksheet
- Click “Download Worksheet” and sign in with Google or email to get the PDF instantly.
- Print at home or in class for Grade 2; it's no-prep, with no extra materials needed.
- Hand it out as classwork, homework, or a quick warm-up.
Likes & comments
See what other teachers think and share a helpful note.
Loading likes and comments…
Create more worksheets in our Worksheet Studio
Generate fresh worksheets for any grade, topic, and language — free.
Open the Worksheet StudioRelated worksheets
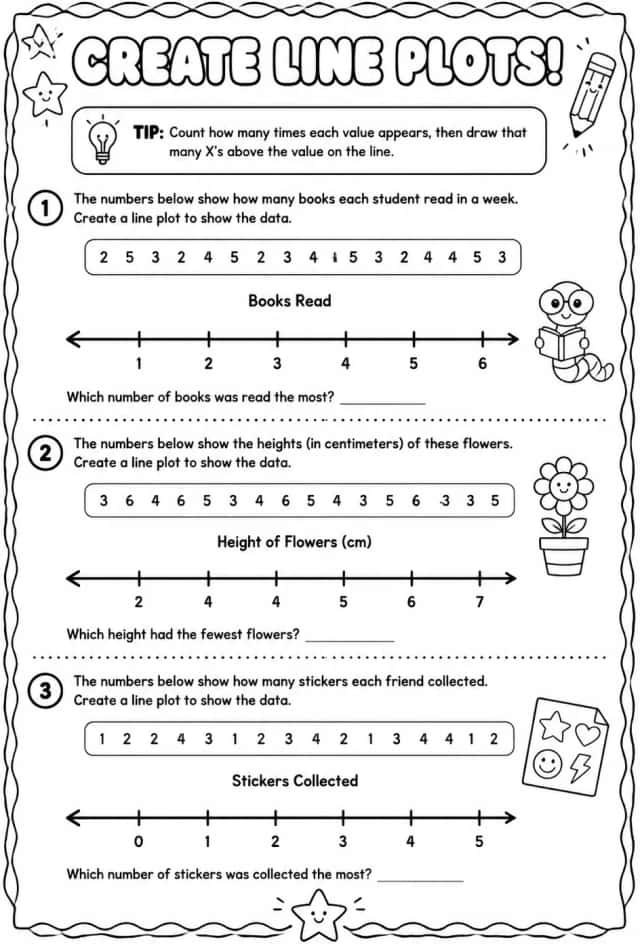
Create line plots
Worksheets
medium
Ages 7–8
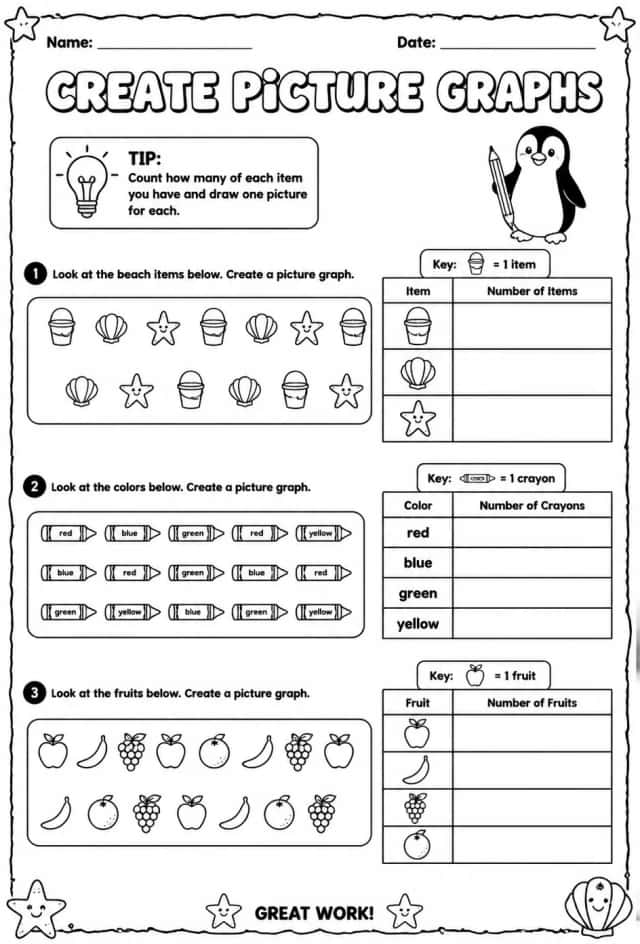
Create picture graphs
Worksheets
medium
Ages 7–8
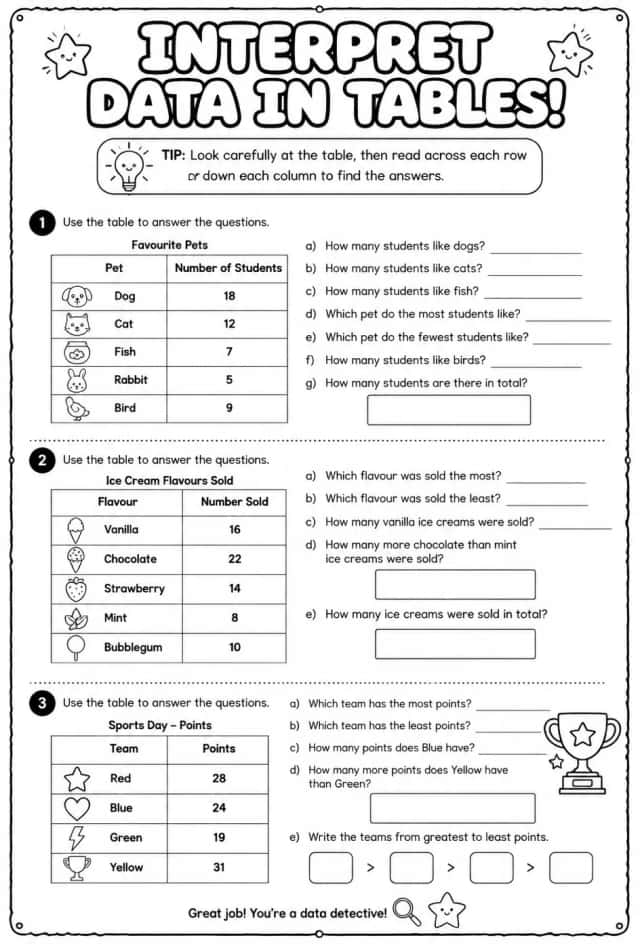
Interpret data in tables
Worksheets
medium
Ages 7–8
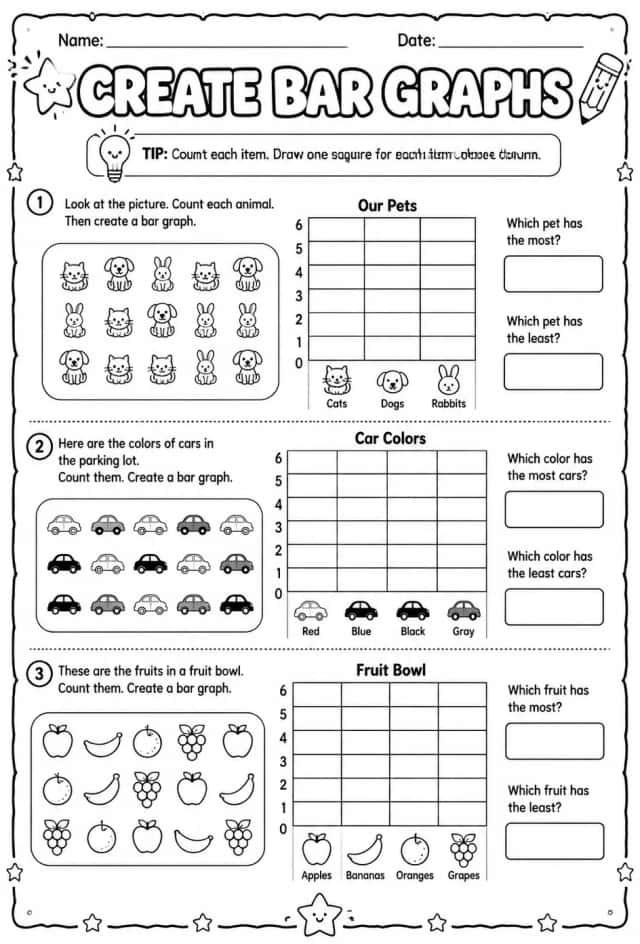
Create bar graphs
Worksheets
medium
Ages 7–8
Pack
Grade 2 Data And Graphs Math Worksheet Pack
Pack
math
medium
Ages 7–9
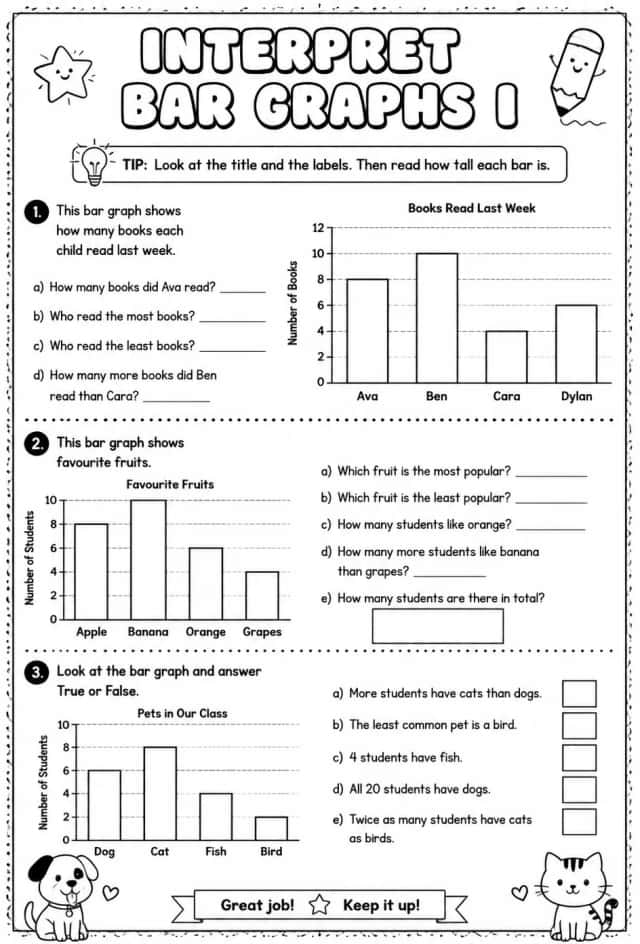
Interpret bar graphs I
Worksheets
medium
Ages 7–8
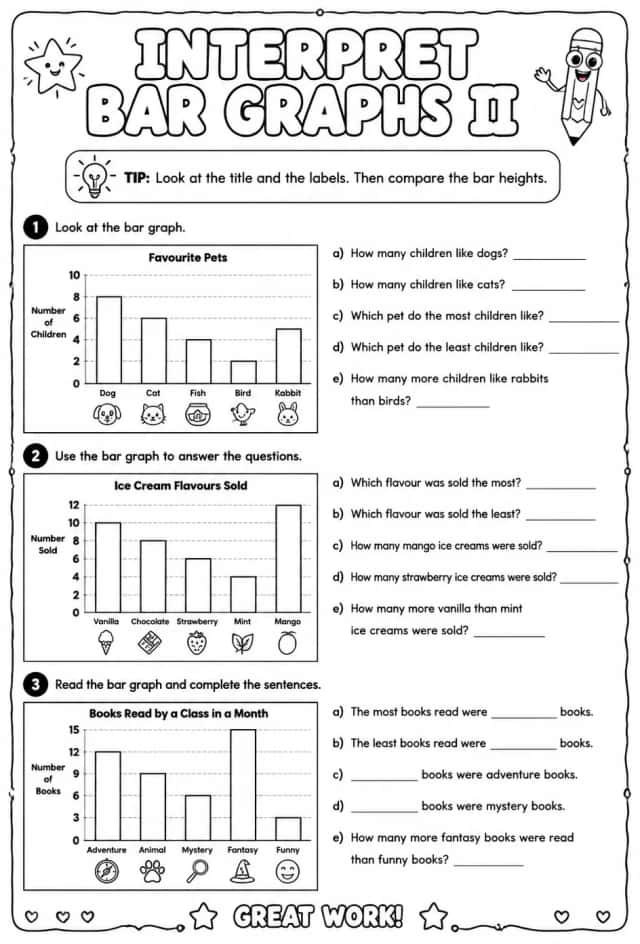
Interpret bar graphs II
Worksheets
medium
Ages 7–8
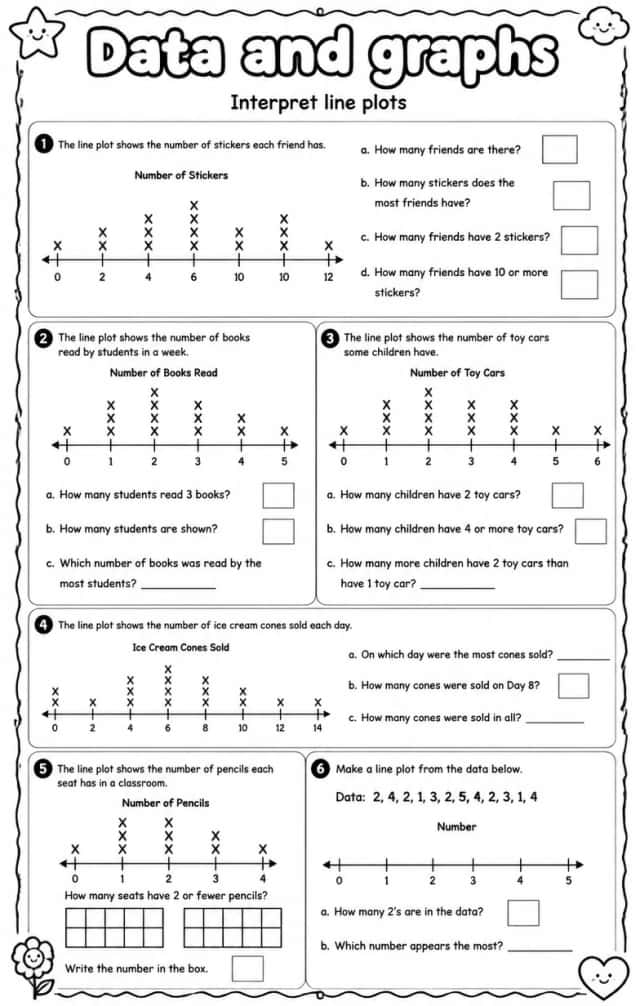
Interpret line plots
Worksheets
medium
Ages 7–8