MathGrade 5
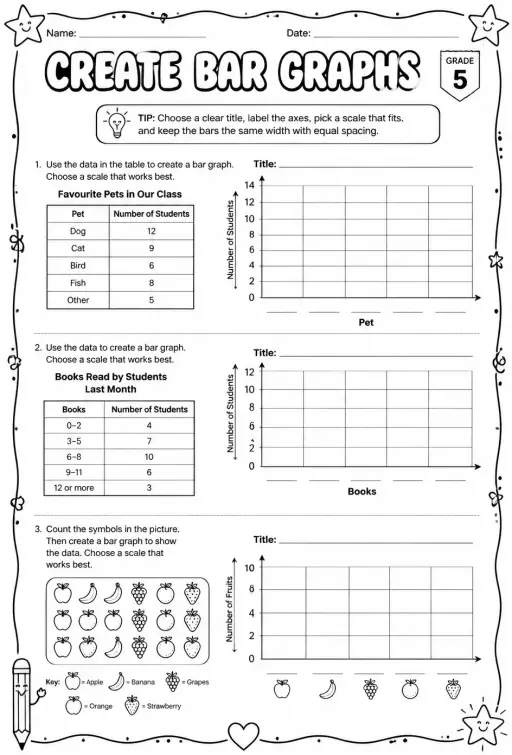
Create bar graphs
Free printable Grade 5 math worksheet for "Create bar graphs" — practice data and graphs. No-prep, print or assign online.
——
KiwiBee uses optional Google Analytics, Google Ads, and Meta Pixel cookies to understand adult visitors, measure completed sign-ups, and improve campaigns. Essential cookies always stay on. OpenAI’s ChatGPT Ads Pixel also measures page views and completed enquiries after advertising consent, and may use hashed contact details for matching. Privacy policy

Picked by meaning from games, worksheets, simulations, teacher tools and videos.
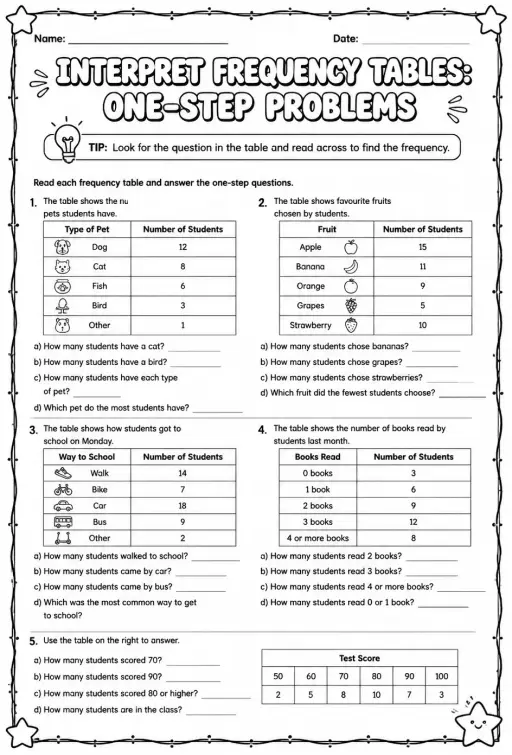 WorksheetInterpret frequency tables: one-step problems
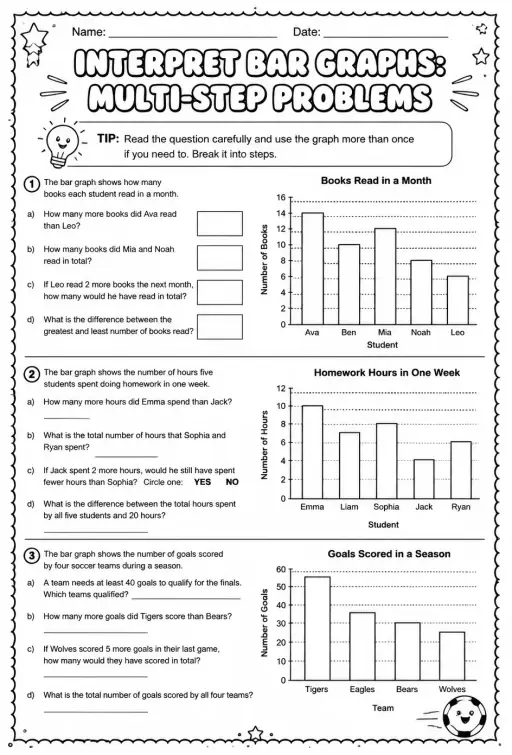 WorksheetInterpret bar graphs: multi-step problems
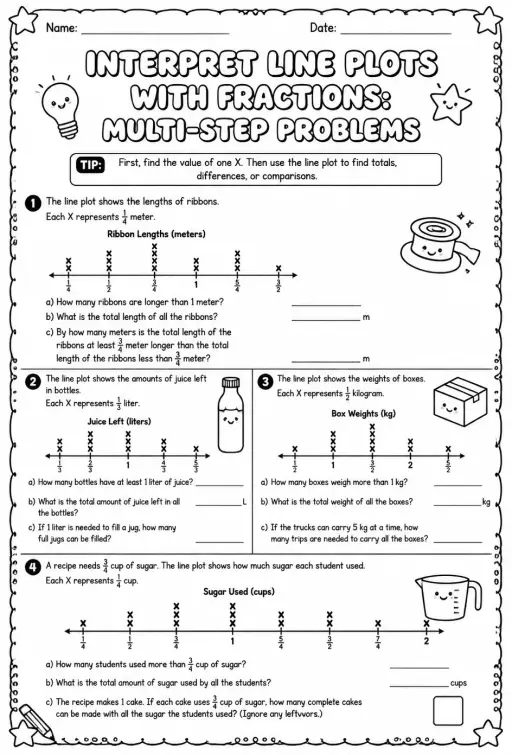 WorksheetInterpret line plots with fractions: multi-step problems
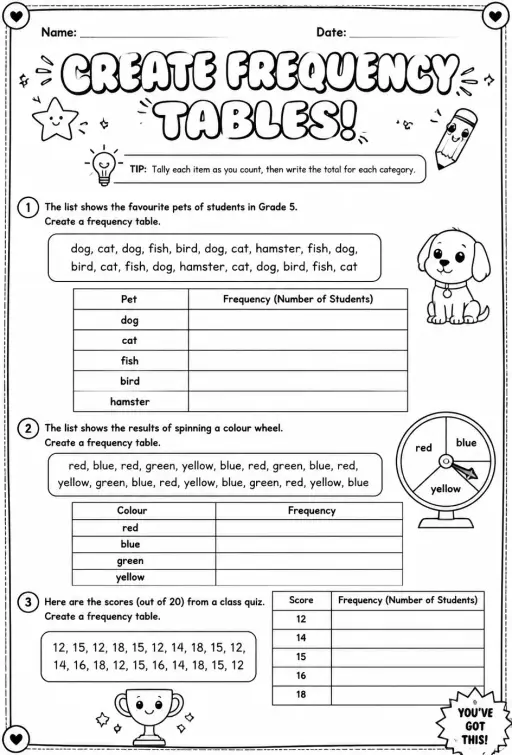 WorksheetCreate frequency tables
 GameData Detectives at School
 GameRisk, Frequency and Conditional Evidence
 GameTravel Plans with Rates
 GameWaves Carry Information
This worksheet helps students practice interpreting frequency tables through challenging multi-step problems. Teachers can use it to reinforce data analysis skills and support critical thinking in understanding data and graphs. Ideal for Grade 5 math lessons focused on data interpretation and problem-solving.
Learning objectives © UCLES (Cambridge University Press & Assessment), quoted with attribution.
Skill lists aligned to IXL Learning skill plans, carried over from KiwiBee's System presets; the Maths section names are KiwiBee's own. IXL is a trademark of IXL Learning; no endorsement is implied.
Free printable Grade 5 math worksheet for "Create bar graphs" — practice data and graphs. No-prep, print or assign online.
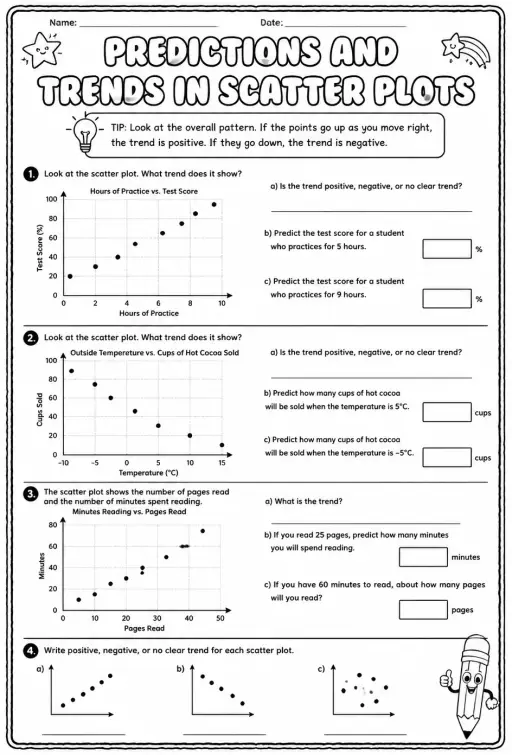
Free printable Grade 5 math worksheet for "Predictions and trends in scatter plots" — practice data and graphs. No-prep, print or assign online.
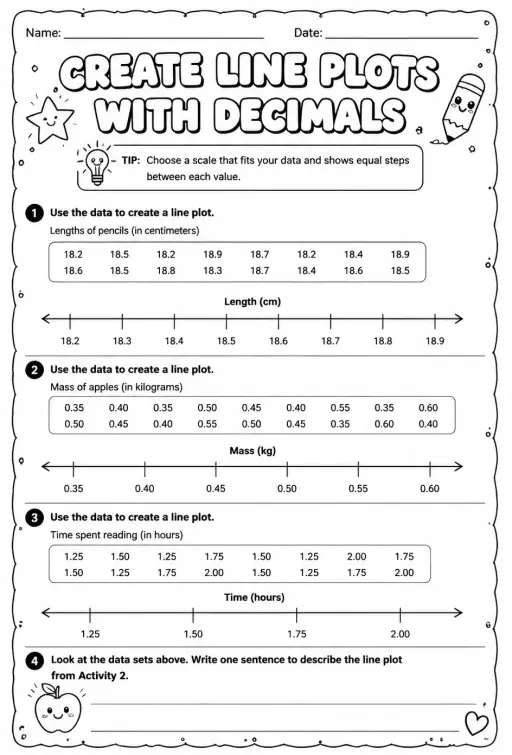
Free printable Grade 5 math worksheet for "Create line plots with decimals" — practice data and graphs. No-prep, print or assign online.

Free printable Grade 5 math worksheet for "Interpret scatter plots" — practice data and graphs. No-prep, print or assign online.
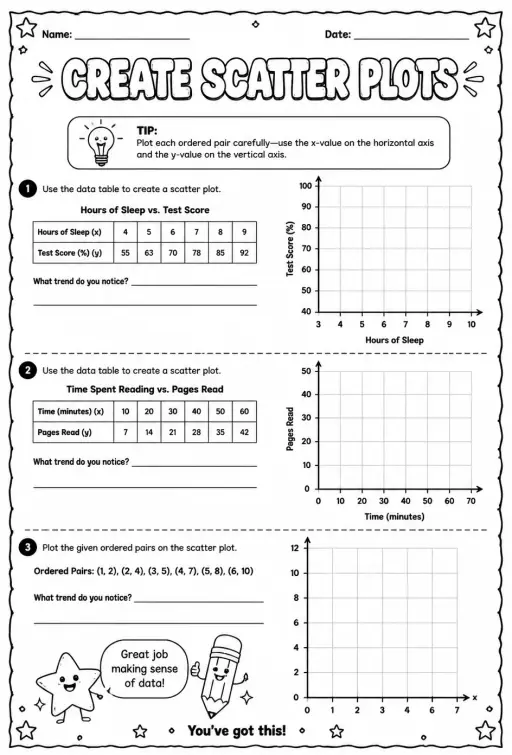
Free printable Grade 5 math worksheet for "Create scatter plots" — practice data and graphs. No-prep, print or assign online.
See what other teachers think and share a helpful note.
Generate a fresh worksheet for any grade, topic and language. Free.
 Home
 All solutions
 Pricing
 About us
 KiwiBee for Non-profits
 Events & webinars
 For big organisations
 For schools
 For centers
 For team leaders
 For teachers
 Resources
 Printable worksheets
 Interactive simulations
 Teacher tools
 Ideas and research


