KiwiBee printable
Interpret charts and graphs to find the range
Free printable Grade 5 math worksheet for "Interpret charts and graphs to find the range" — practice statistics. No-prep, print or assign online.
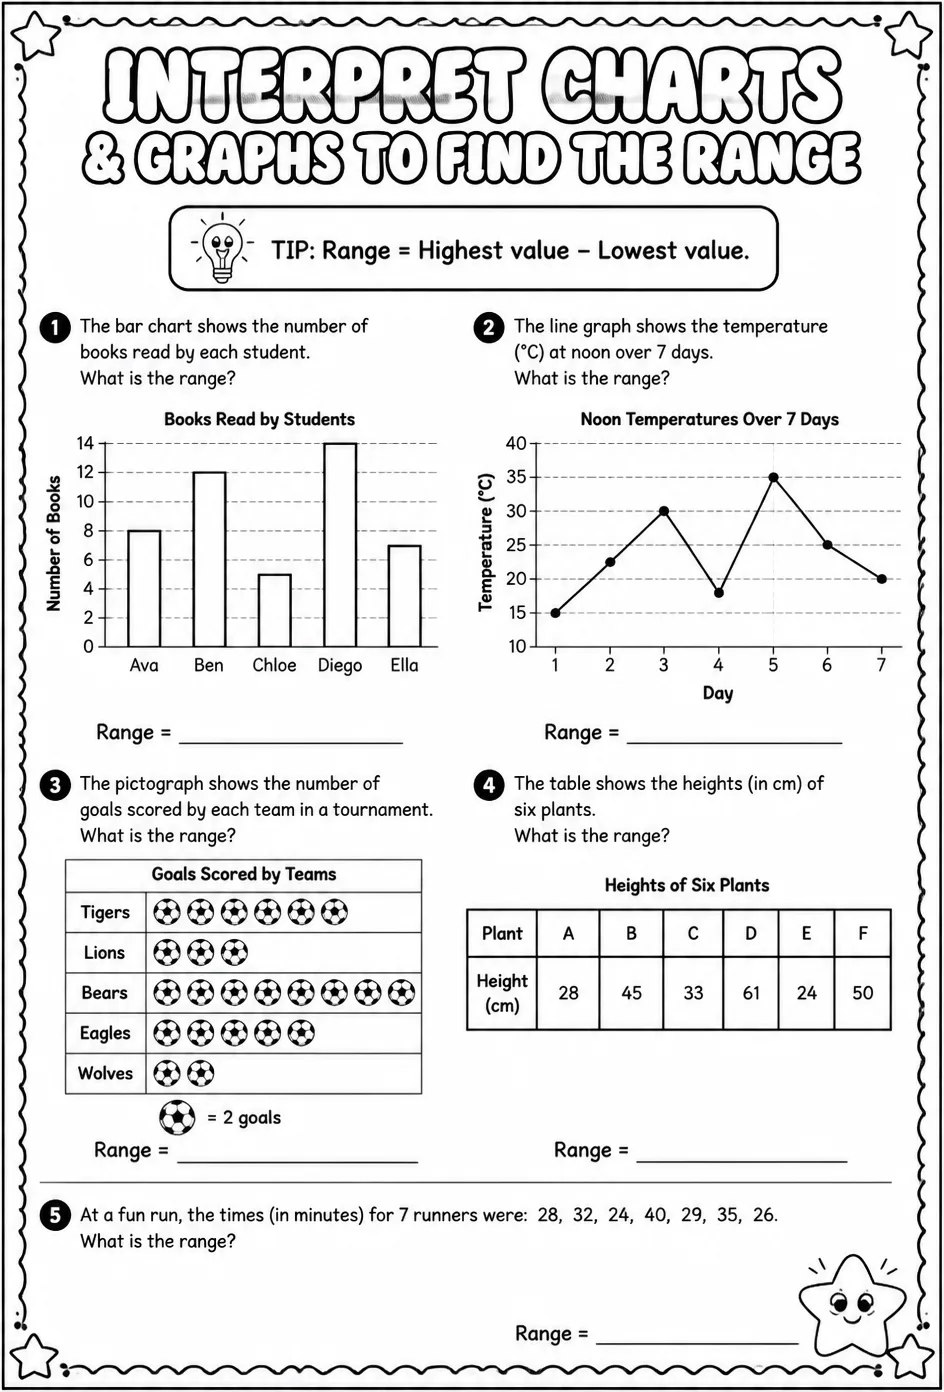
This worksheet challenges students to interpret different types of charts and graphs to determine the range of data sets. Teachers can use it to enhance students' skills in reading graphical data and understanding statistical concepts in real-world contexts. It is ideal for reinforcing critical thinking and data analysis abilities in grade 5 statistics lessons.
Learning objectives
- Analyze various charts and graphs to extract numerical data accurately
- Calculate the range by identifying the highest and lowest values from data sets
- Interpret statistical information to solve complex problems involving data variability
How to use this worksheet
- Select “Sign in to download free”, then sign in with Google or email to get the PDF from KiwiBee Printables.
- Print at home or in class for Grade 5; it's no-prep, with no extra materials needed.
- Hand it out as classwork, homework, or a quick warm-up.
Likes & comments
See what other teachers think and share a helpful note.
Loading likes and comments…
Create more worksheets in our Worksheet Studio
Generate fresh worksheets for any grade, topic, and language — free.
Open the Worksheet StudioRelated worksheets
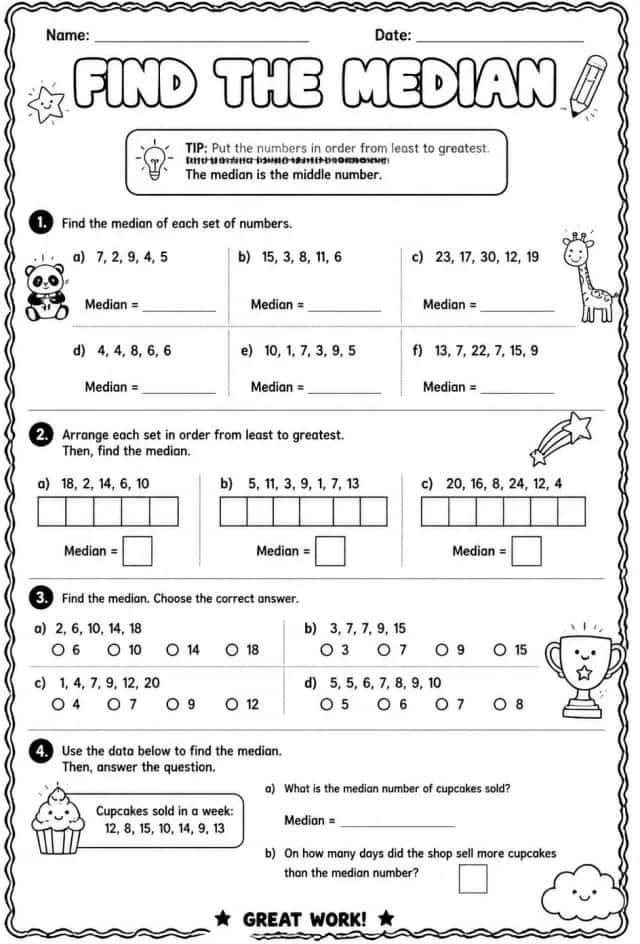
Find the median
Worksheets
hard
Ages 10–11
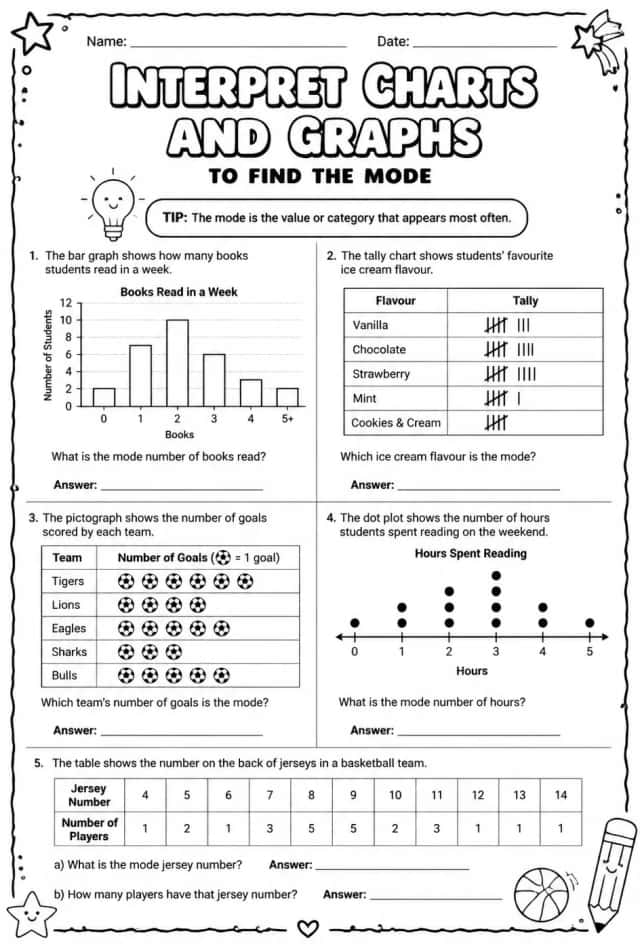
Interpret charts and graphs to find the mode
Worksheets
hard
Ages 10–11
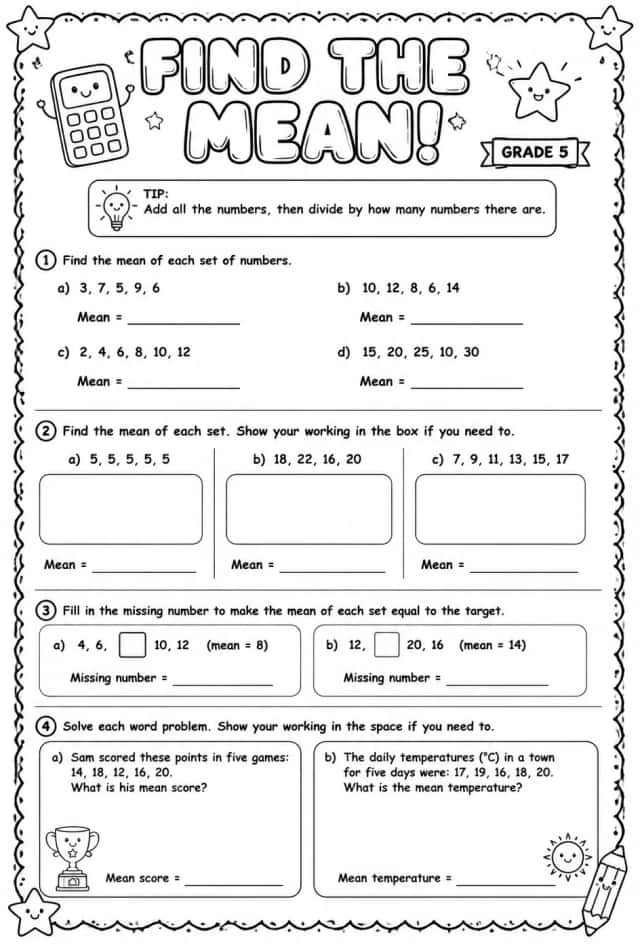
Find the mean
Worksheets
hard
Ages 10–11
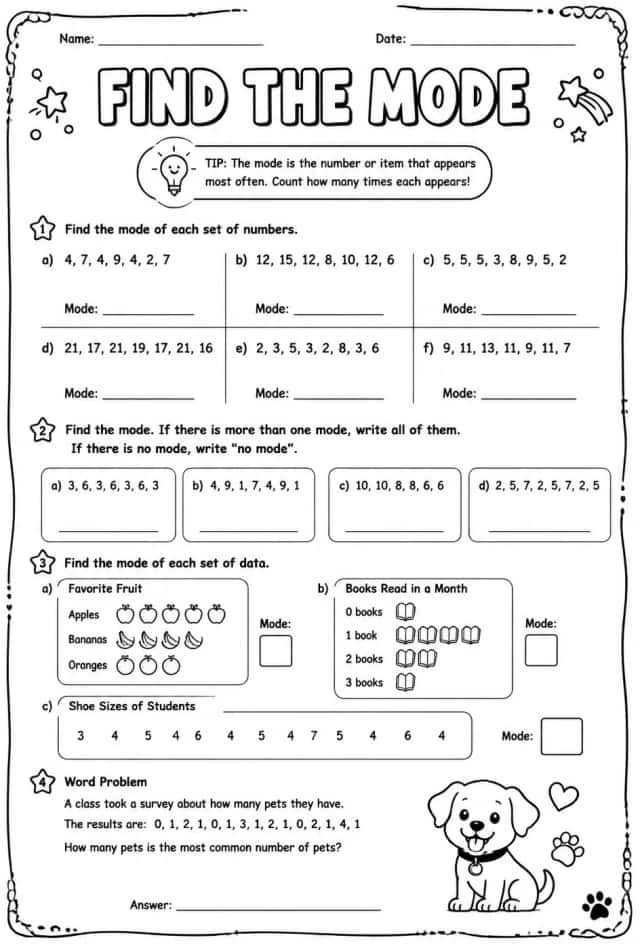
Find the mode
Worksheets
hard
Ages 10–11
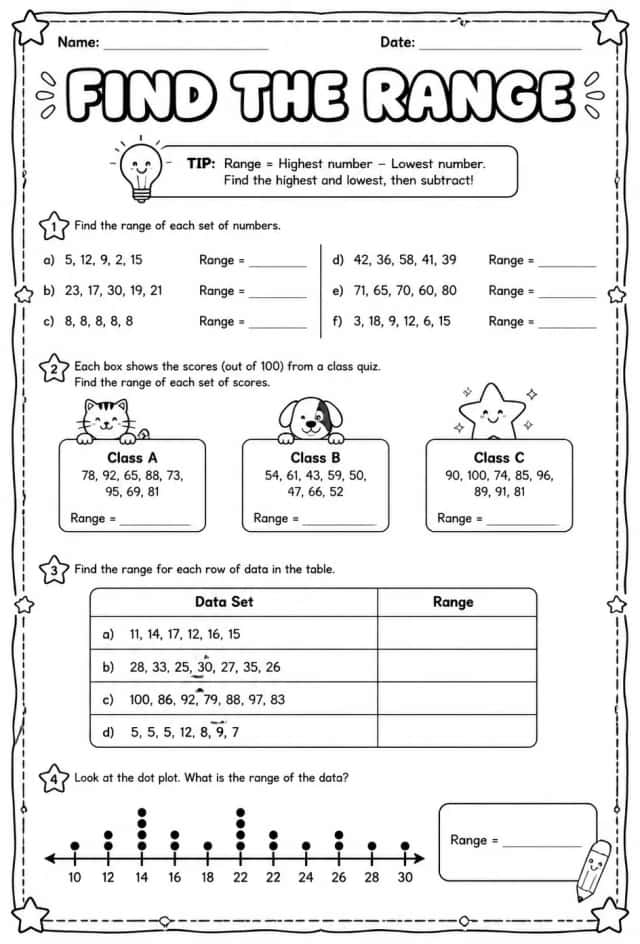
Find the range
Worksheets
hard
Ages 10–11
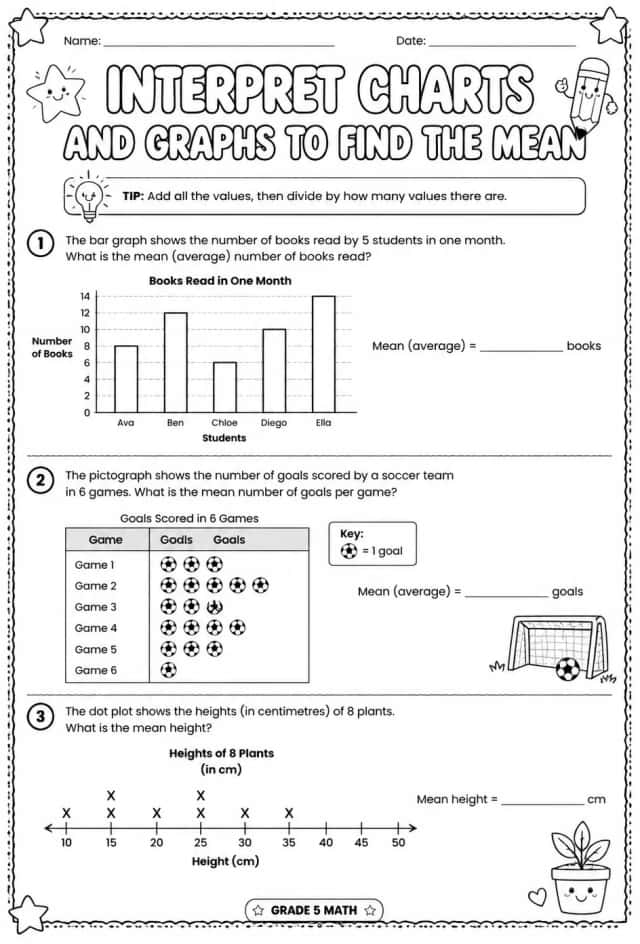
Interpret charts and graphs to find the mean
Worksheets
hard
Ages 10–11
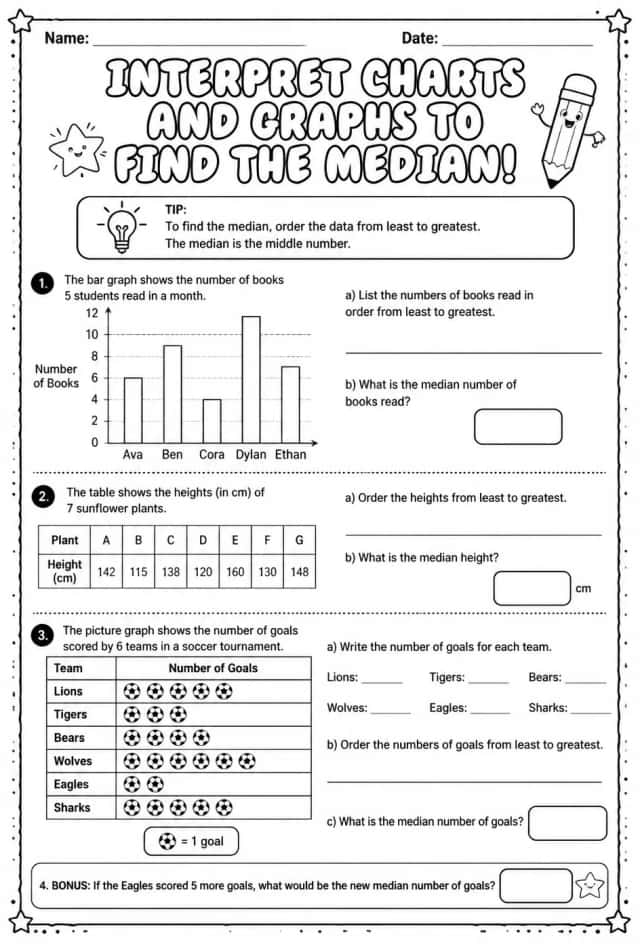
Interpret charts and graphs to find the median
Worksheets
hard
Ages 10–11
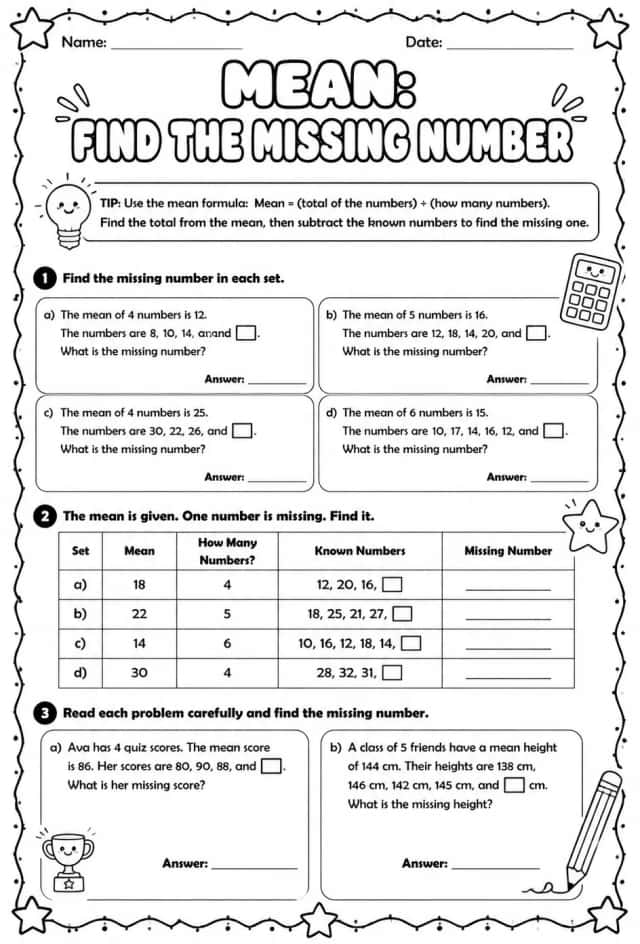
Mean: find the missing number
Worksheets
hard
Ages 10–11