KiwiBee printable
Identify an outlier and describe the effect of removing it
Free printable Grade 8 math worksheet for "Identify an outlier and describe the effect of removing it" — practice one-variable statistics. No-prep, print or assign online.
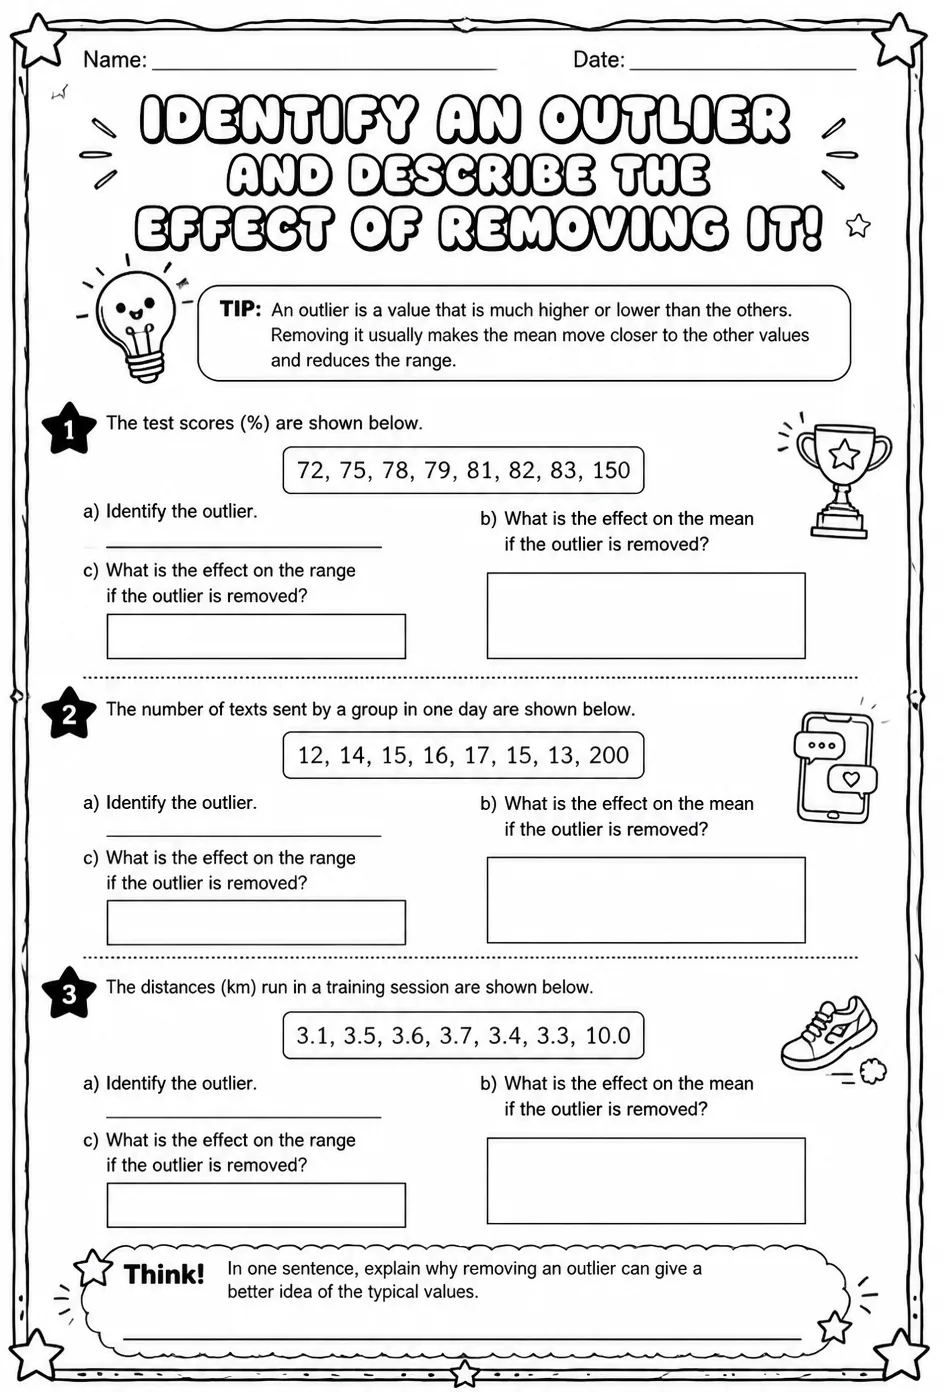
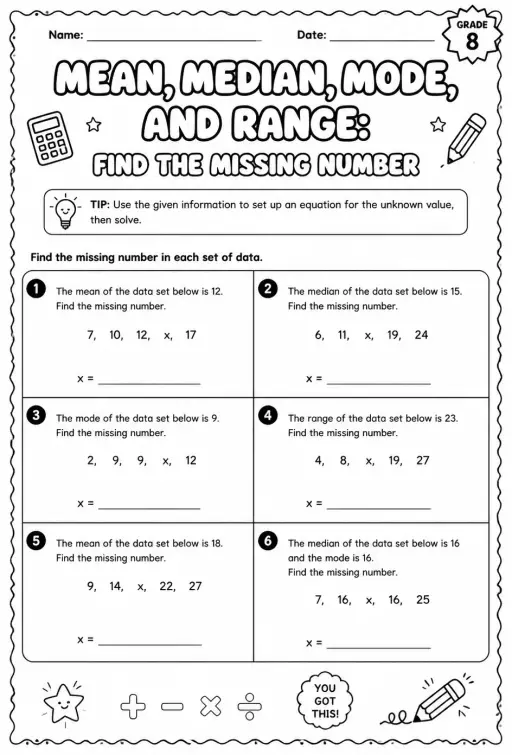
This worksheet challenges students to detect outliers within one-variable data sets and articulate the consequences of excluding these values. Designed for Grade 8 math classes, it supports instruction on one-variable statistics by promoting critical thinking about data distribution and summary statistics. Teachers can use this resource to reinforce concepts of data analysis and improve students' understanding of outlier effects on mean, median, and range.
Learning objectives
- Identify outliers in a given data set using statistical methods
- Explain how removing an outlier affects measures of central tendency and variability
- Analyze data sets to determine the impact of outliers on data interpretation
How to use this worksheet
- Select “Sign in to download free”, then sign in with Google or email to get the PDF from KiwiBee Printables.
- Print at home or in class for Middle School; it's no-prep, with no extra materials needed.
- Hand it out as classwork, homework, or a quick warm-up.
Likes & comments
See what other teachers think and share a helpful note.
Create more worksheets in our Worksheet Studio
Generate fresh worksheets for any grade, topic, and language — free.
Open the Worksheet StudioRelated worksheets
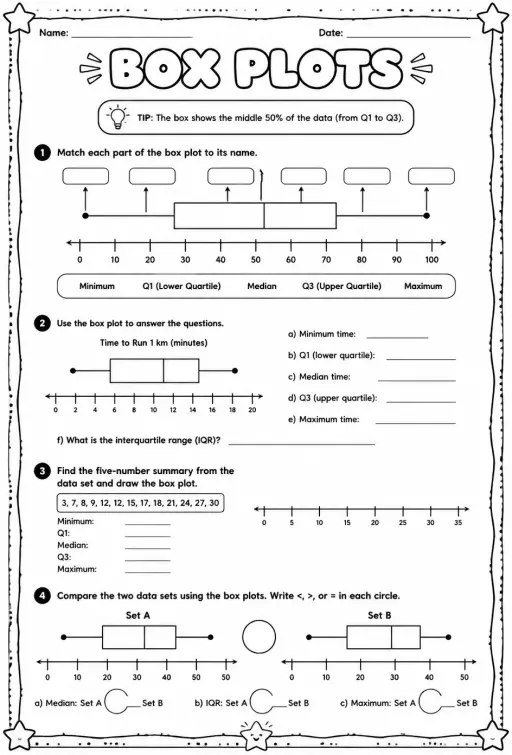
Box plots
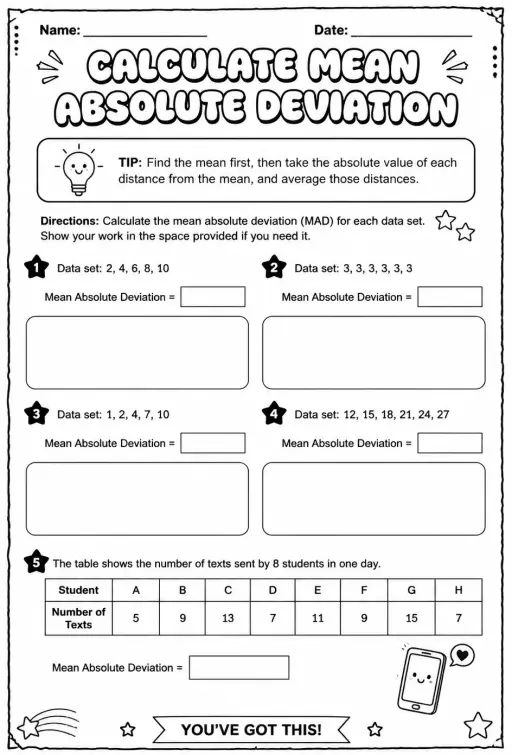
Calculate mean absolute deviation
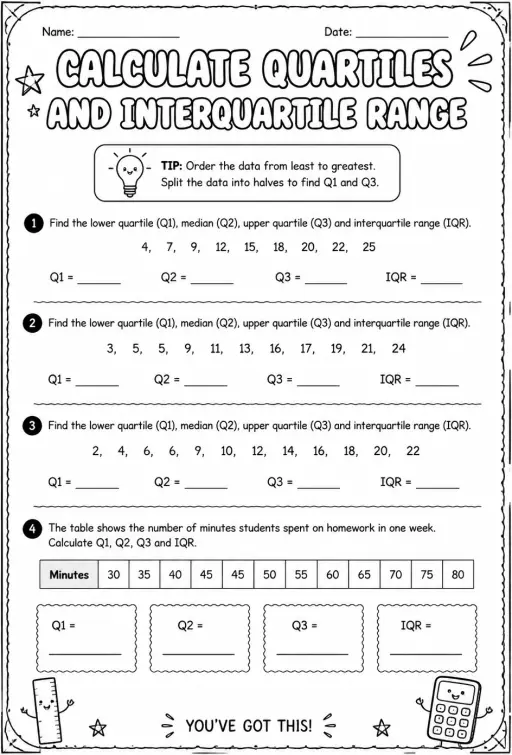
Calculate quartiles and interquartile range
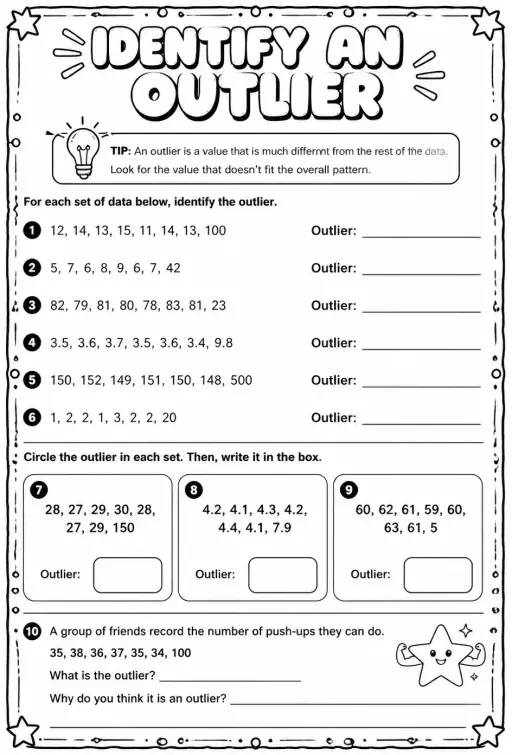
Identify an outlier
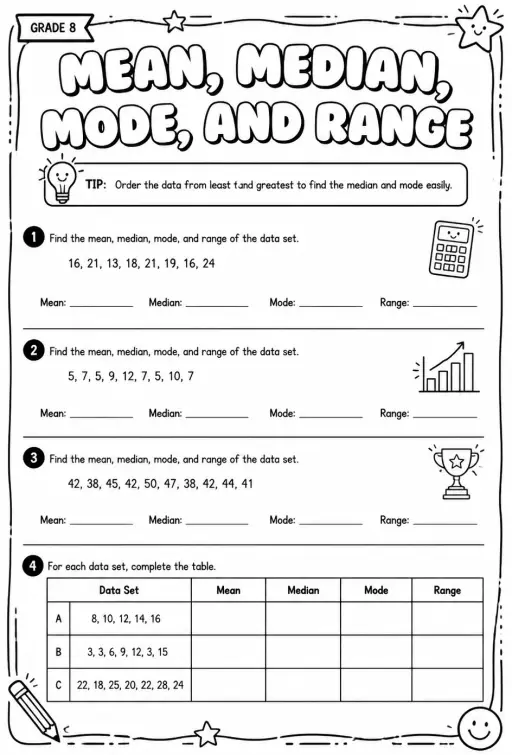
Calculate mean, median, mode, and range
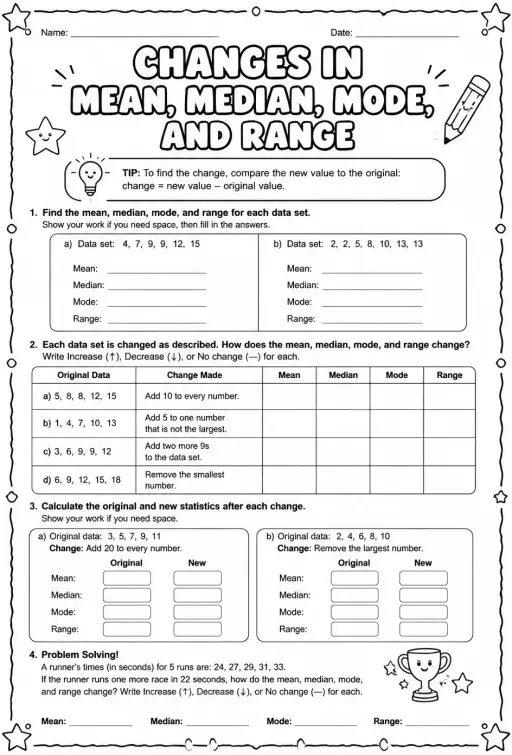
Changes in mean, median, mode, and range
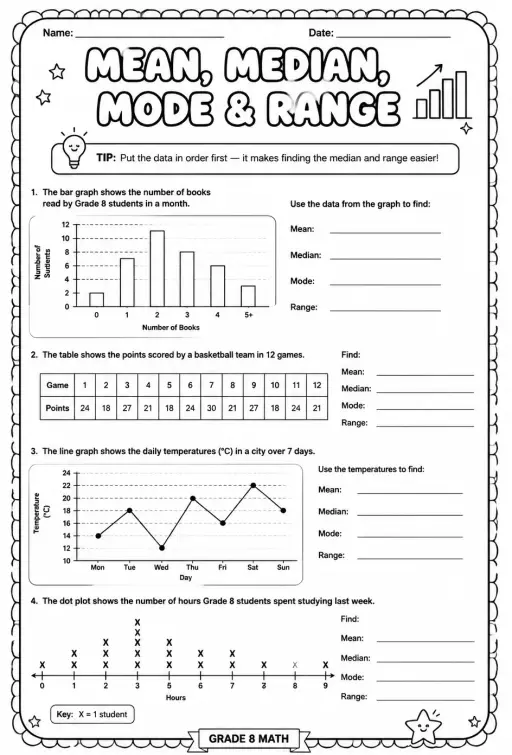
Interpret charts and graphs to find mean, median, mode, and range
 For big organisations
 For schools
 For centers
 For team leaders
 For teachers
 AI and resources
 Printable worksheets
 Interactive simulations
 Teacher tools
 AI studio
 Ideas and research