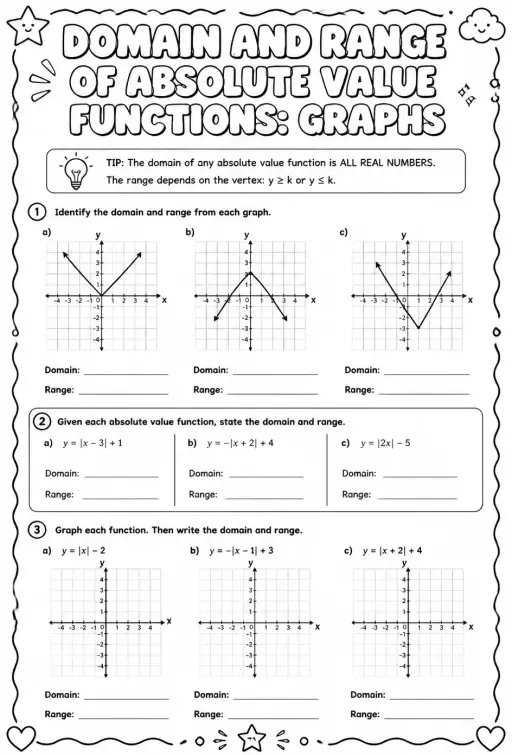
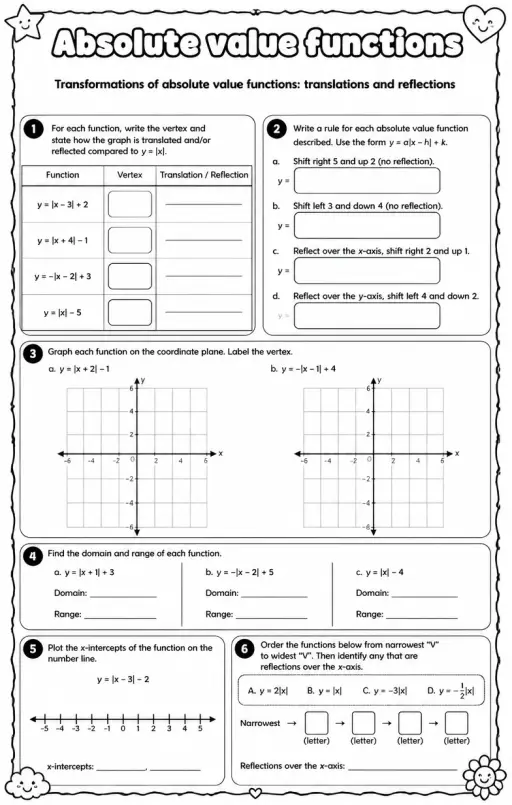
Domain and range of absolute value functions: graphs
Worksheets
hard
Ages 14–18
——
KiwiBee uses optional Google Analytics, Google Ads, and Meta Pixel cookies to understand adult visitors, measure completed sign-ups, and improve campaigns. Essential cookies always stay on. OpenAI’s ChatGPT Ads Pixel also measures page views and completed enquiries after advertising consent, and may use hashed contact details for matching. Privacy policy

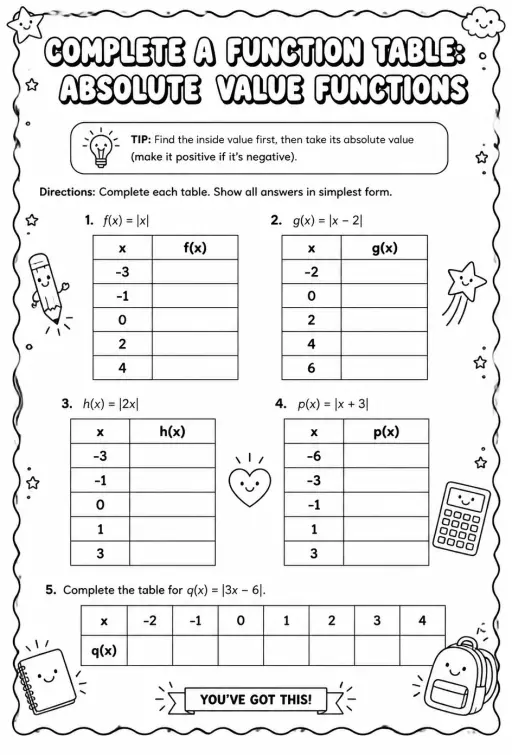
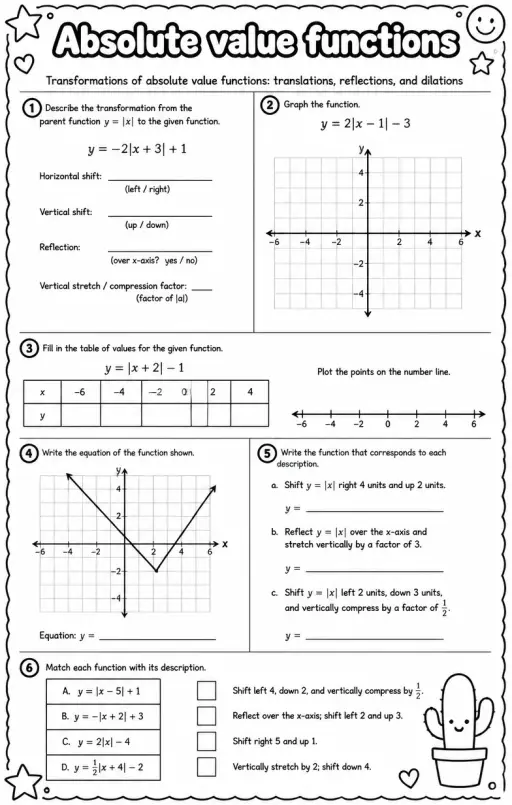
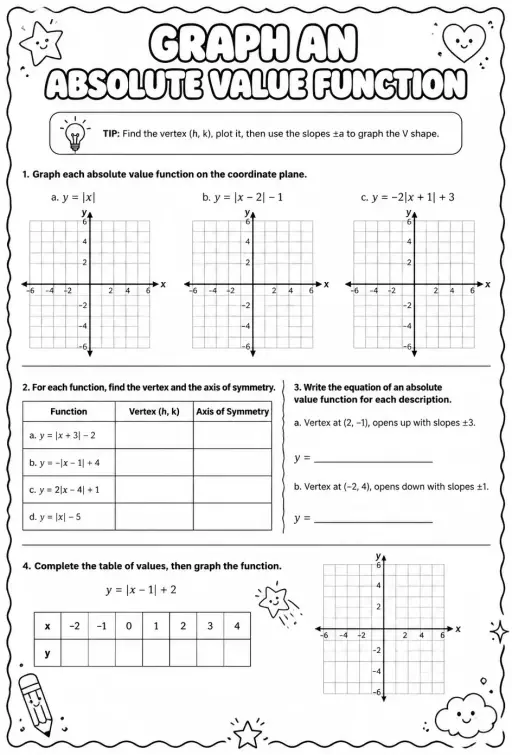
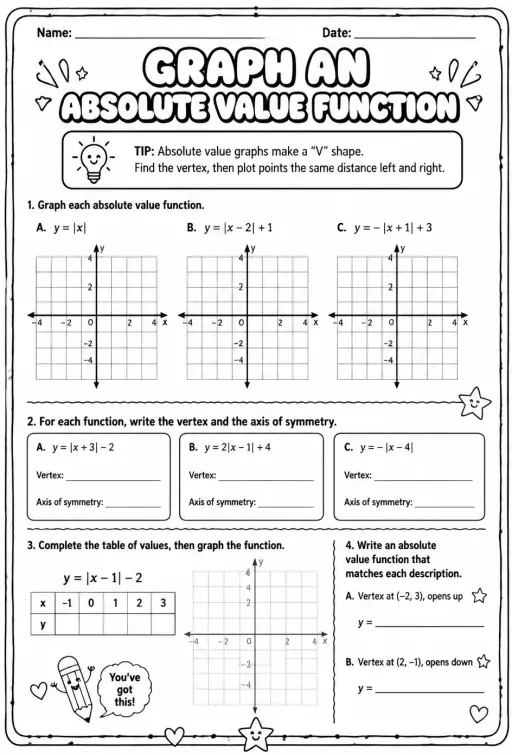
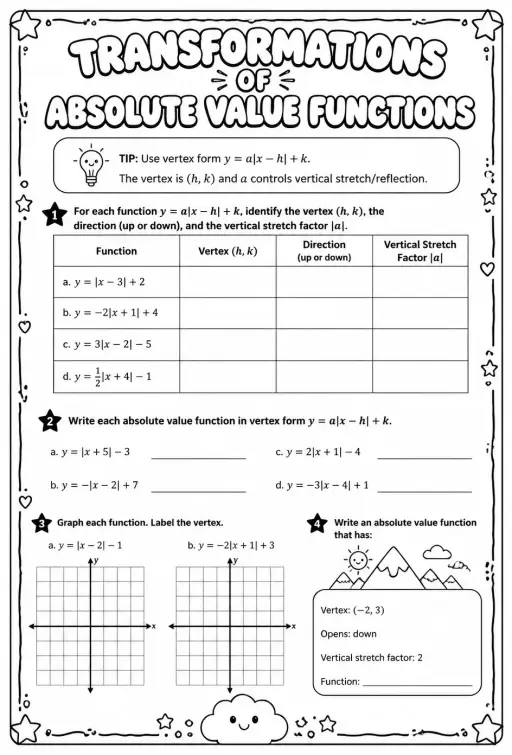
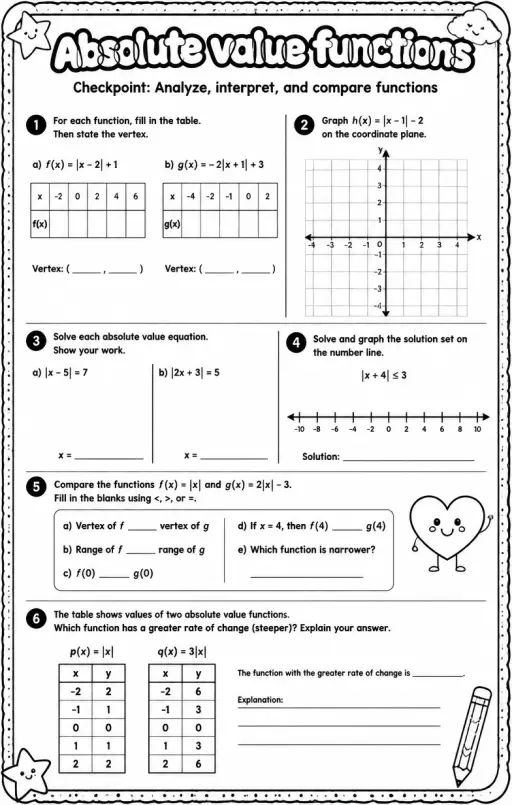
This worksheet provides challenging practice for high school Algebra 2 students to graph solutions of two-variable absolute value inequalities. Teachers can use it to reinforce concepts of absolute value functions and inequality graphing, helping students visualize solution regions effectively. The exercises promote critical thinking and precision in plotting boundary lines and shading solution areas on coordinate planes.
See what other teachers think and share a helpful note.
Generate a fresh worksheet for any grade, topic and language. Free.
 Home
 All solutions
 Pricing
 About us
 KiwiBee for Non-profits
 Events & webinars
 For big organisations
 For schools
 For centers
 For team leaders
 For teachers
 AI and resources
 Resources
 Printable worksheets
 Lesson Packs
 Interactive simulations
 Teacher tools
 AI studio
 Ideas and research