KiwiBee printable
Constant rate of change: tables
Free printable Grade 7 math worksheet for "Constant rate of change: tables" — practice slope. No-prep, print or assign online.
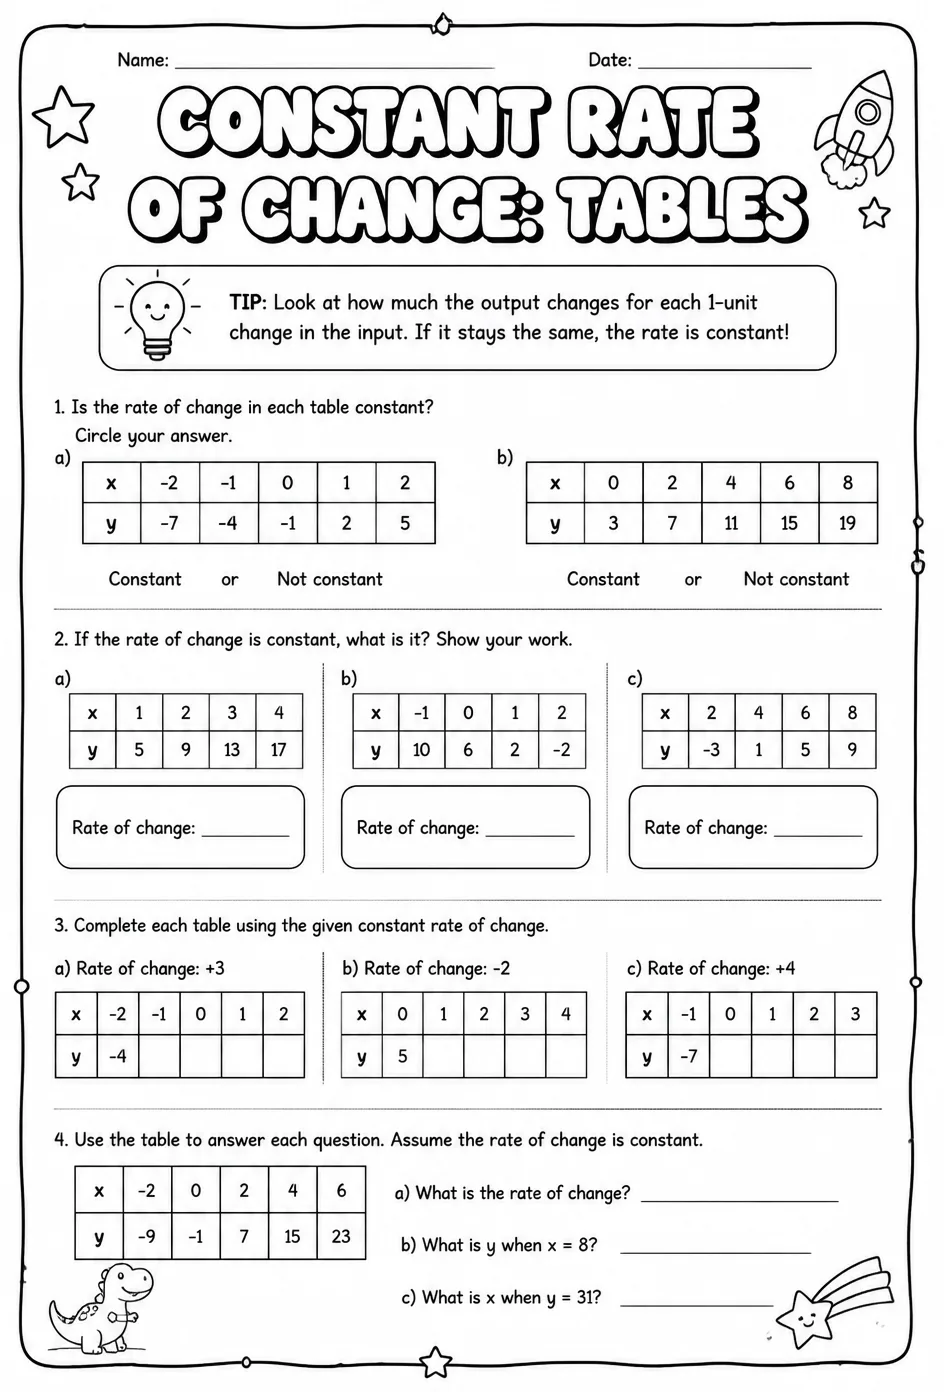
This challenging worksheet focuses on understanding constant rate of change through tables, specifically targeting Grade 7 students studying slope. Teachers can use it to reinforce skills in interpreting data sets and calculating slopes from tabular information. It supports lessons on linear relationships and prepares students for graphing by deepening comprehension of rate of change.
Learning objectives
- Analyze tables to identify constant rates of change between variables
- Calculate the slope from given data sets in tabular form
- Interpret the meaning of slope in real-world contexts using tables
How to use this worksheet
- Click “Download Worksheet” and sign in with Google or email to get the PDF instantly.
- Print at home or in class for Middle School; it's no-prep, with no extra materials needed.
- Hand it out as classwork, homework, or a quick warm-up.
Likes & comments
See what other teachers think and share a helpful note.
Loading likes and comments…
Create more worksheets in our Worksheet Studio
Generate fresh worksheets for any grade, topic, and language — free.
Open the Worksheet StudioRelated worksheets
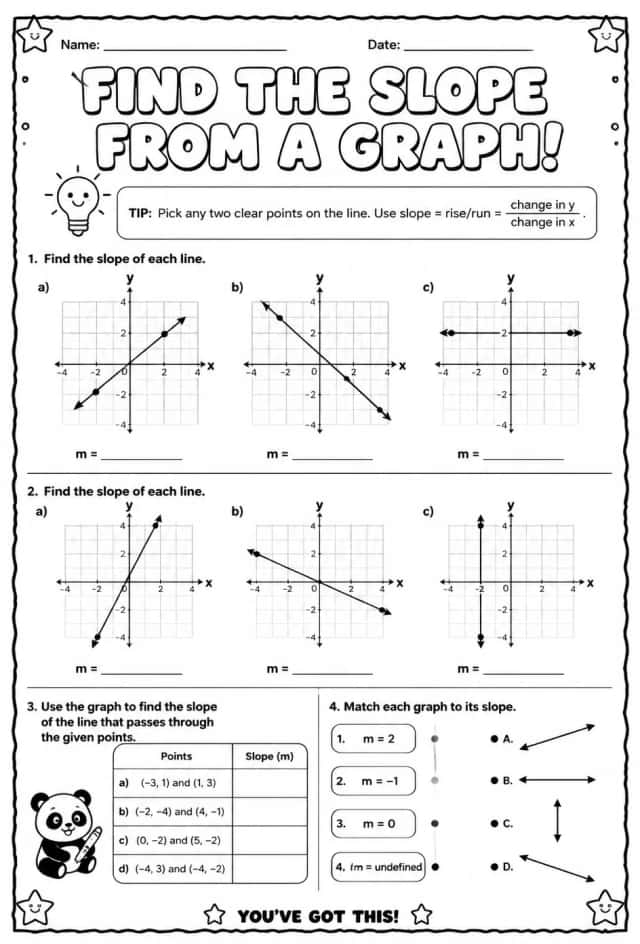
Find the slope from a graph
Worksheets
hard
Ages 11–14
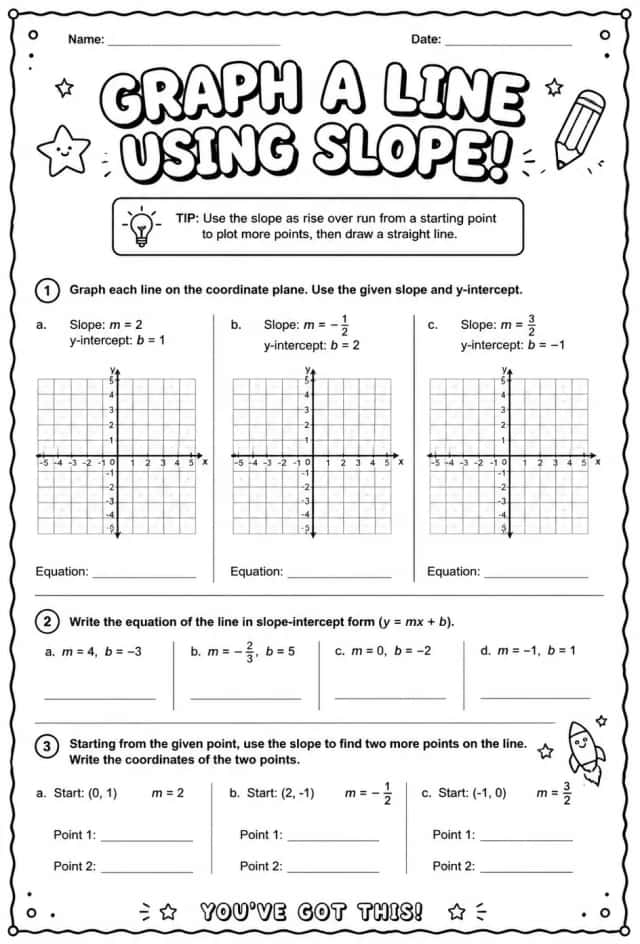
Graph a line using slope
Worksheets
hard
Ages 11–14
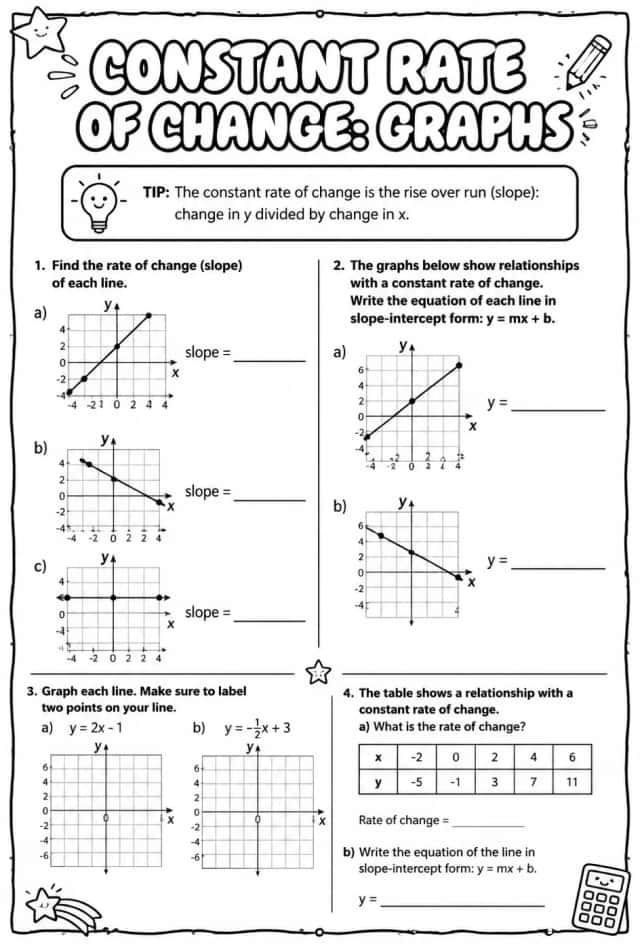
Constant rate of change: graphs
Worksheets
hard
Ages 11–14
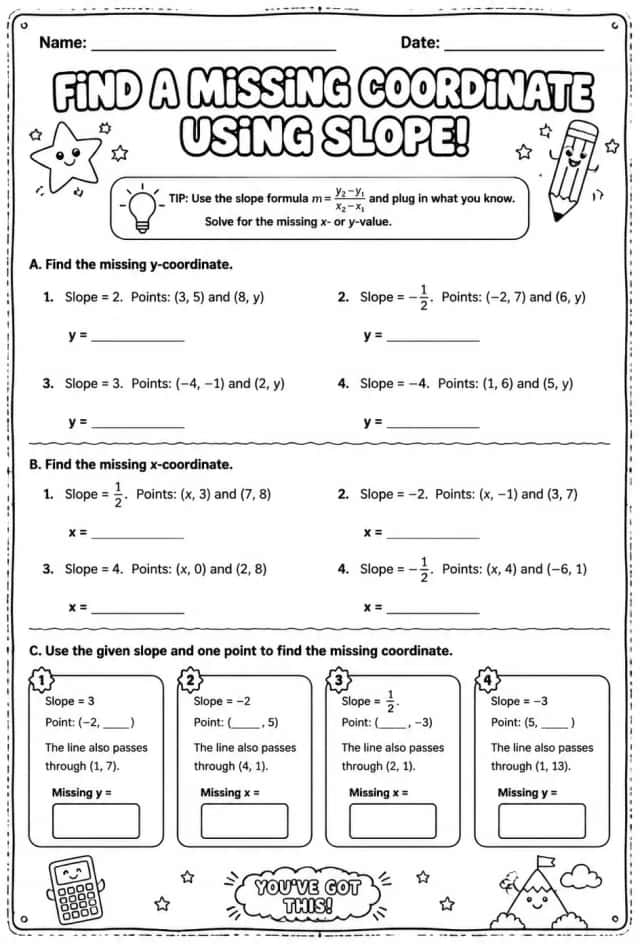
Find a missing coordinate using slope
Worksheets
hard
Ages 11–14
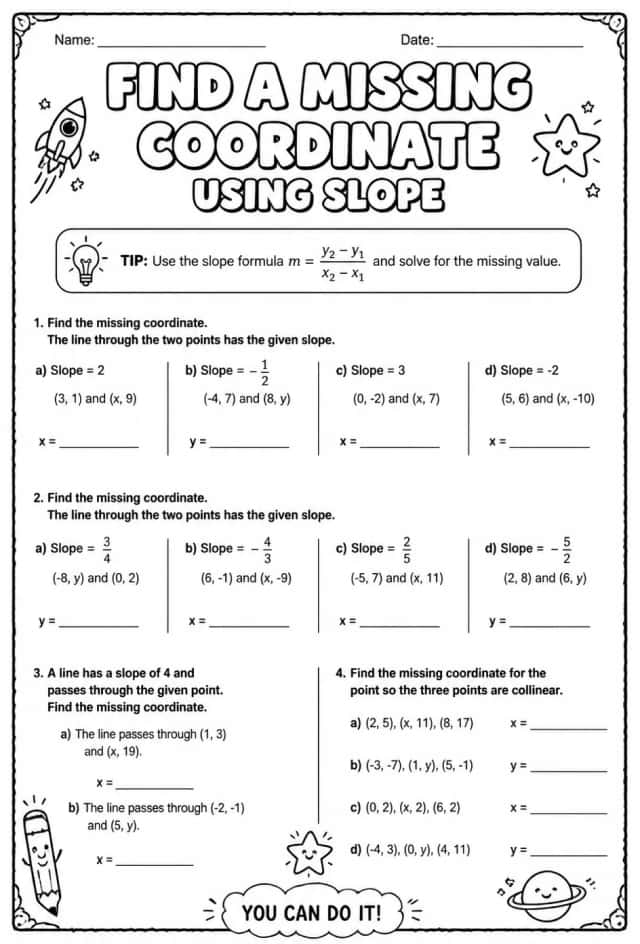
Find a missing coordinate using slope
Worksheets
hard
Ages 11–14
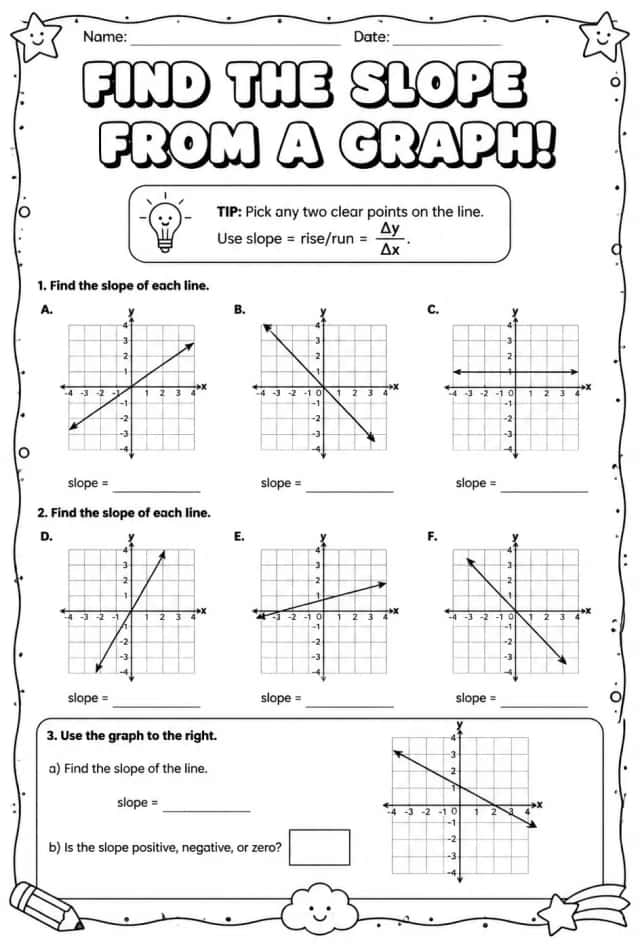
Find the slope from a graph
Worksheets
hard
Ages 11–14
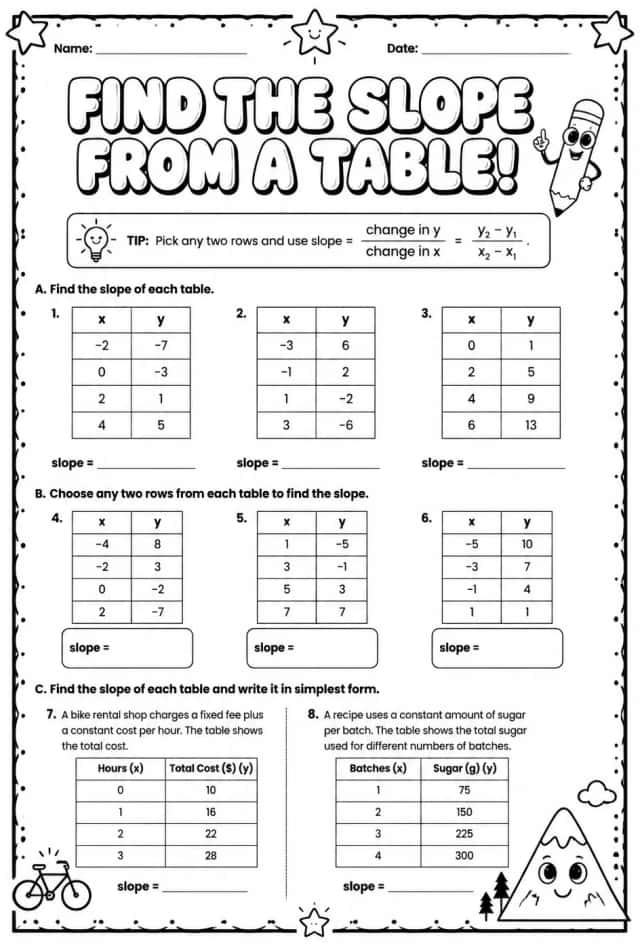
Find the slope from a table
Worksheets
hard
Ages 11–14
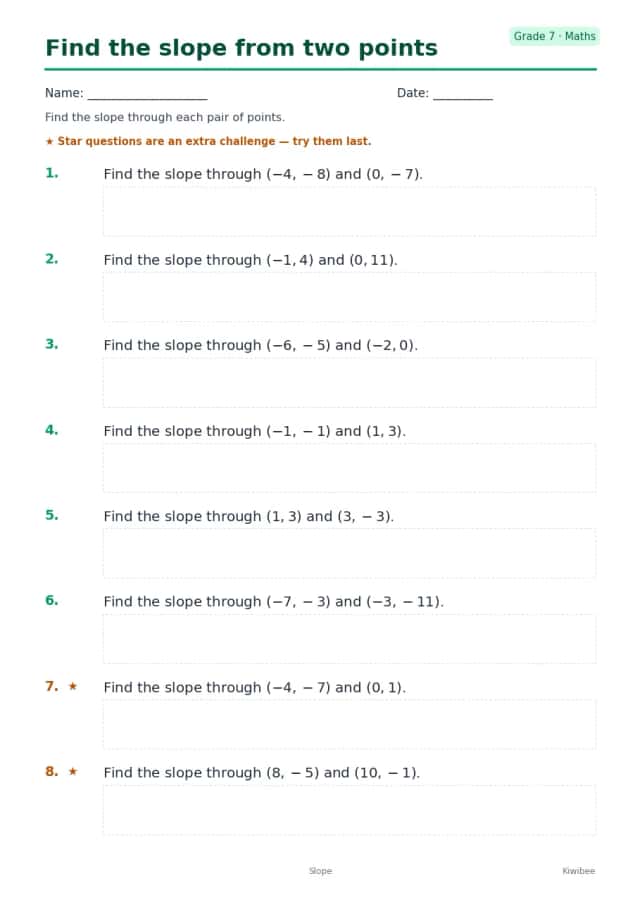
Find the slope from two points
Worksheets
medium
Ages 11–14