
Your privacy choices

KiwiBee uses optional Google Analytics, Google Ads, and Meta Pixel cookies to understand adult visitors, measure completed sign-ups, and improve campaigns. Essential cookies always stay on. OpenAI’s ChatGPT Ads Pixel also measures page views and completed enquiries after advertising consent, and may use hashed contact details for matching. Privacy policy

Skip to main content

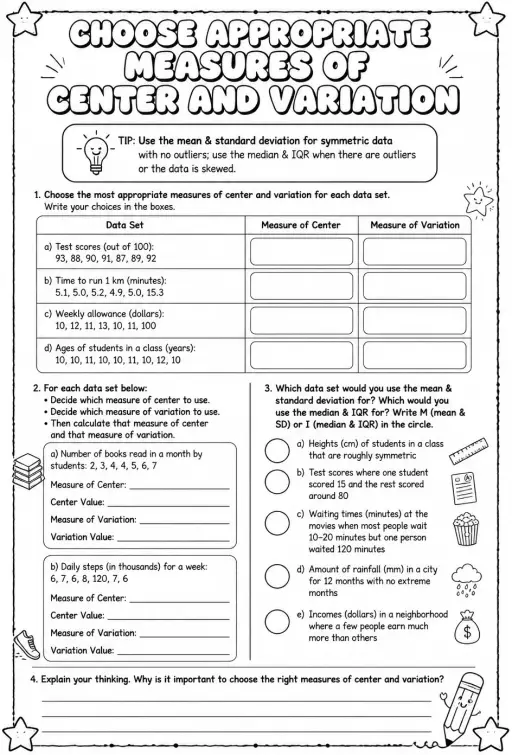
Choose appropriate measures of center and variation

Printable PDFScroll to explore
Choose appropriate measures of center and variation — free printable Algebra 1 math worksheet

This worksheet guides students through selecting suitable measures of center and variation for various single-variable data sets. Teachers can use it to reinforce understanding of statistical concepts and improve students' analytical skills in interpreting data distributions. Ideal for Algebra 1 classes focusing on statistics, it supports differentiated instruction and assessment of data analysis proficiency.

Learning objectives

  • Identify appropriate measures of center and variation for given data sets
  • Analyze data distributions to select mean, median, mode, range, variance, or standard deviation
  • Justify the choice of statistical measures based on data characteristics and context

How to use this worksheet

  1. Select “Sign in / Sign up to download”, then sign in with Google or email to get the PDF from KiwiBee Printables.
  2. Print at home or in class for High School; it's no-prep, with no extra materials needed.
  3. Use the included answer key to mark it in seconds.

Good for

ClassworkHomeworkWarm-upCentersSmall groups

Curriculum standards

Cambridge

Learning objectives © UCLES (Cambridge University Press & Assessment), quoted with attribution.

IXL

Skill lists aligned to IXL Learning skill plans, carried over from KiwiBee's System presets; the Maths section names are KiwiBee's own. IXL is a trademark of IXL Learning; no endorsement is implied.

Answer Key

Answer key for Choose appropriate measures of center and variation — free printable Math worksheet
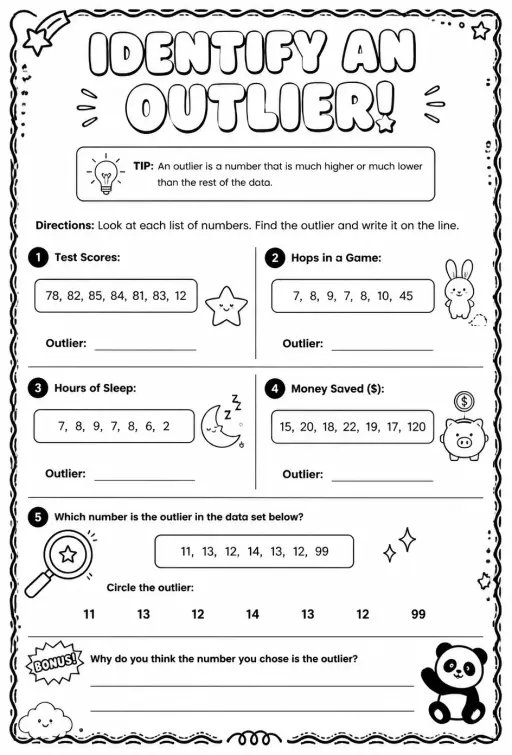
Identify an Outlier in Test Scores, Hops, Sleep and Savings
MathHigh School

Identify an Outlier in Test Scores, Hops, Sleep and Savings

Students find the outlier in lists of test scores, hops in a game, hours of sleep and money saved, such as 15, 20, 18, 22, 19, 17, 120. They circle the outlier in one more data set and explain their choice in a bonus question.

——
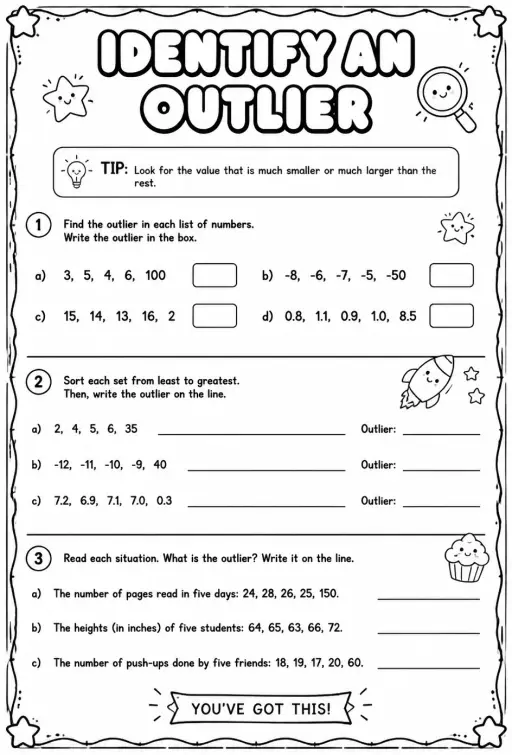
Identify an Outlier: Negatives, Decimals and Sorting
MathHigh School

Identify an Outlier: Negatives, Decimals and Sorting

Students find the outlier in lists with negative numbers and decimals, such as -8, -6, -7, -5, -50 and 0.8, 1.1, 0.9, 1.0, 8.5. They also sort three sets from least to greatest and read three situations, such as push-ups done by five friends.

——
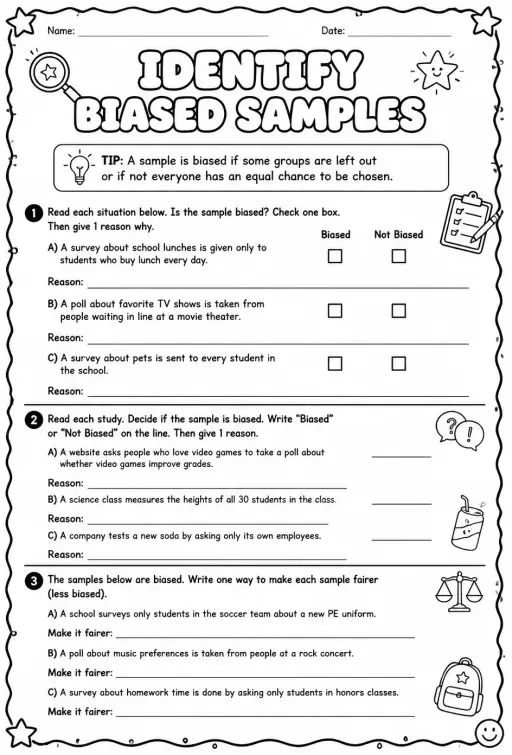
Identify Biased Samples and Make Them Fairer
MathHigh School

Identify Biased Samples and Make Them Fairer

Students read six survey situations, such as asking only students who buy lunch every day, and decide whether each sample is biased, giving a reason. They then suggest one way to make each of three biased samples fairer.

——
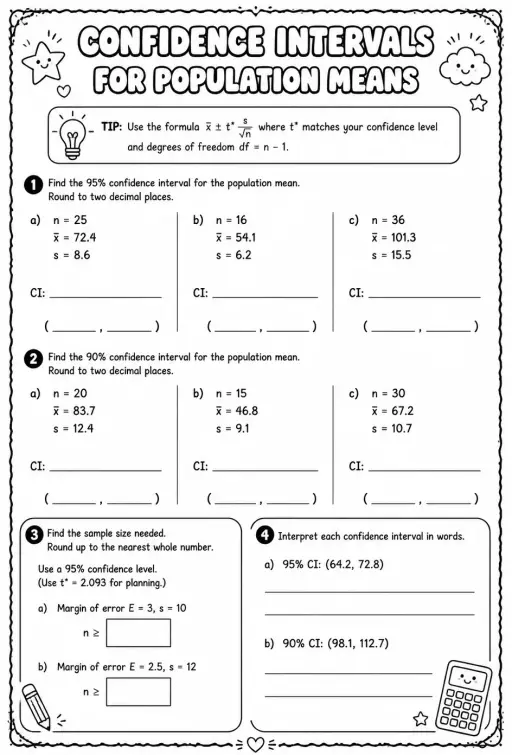
Find confidence intervals for population means
MathHigh School

Find confidence intervals for population means

Free printable Algebra 2 math worksheet for "Find confidence intervals for population means" — practice single-variable statistics. No-prep, print or assign online.

——
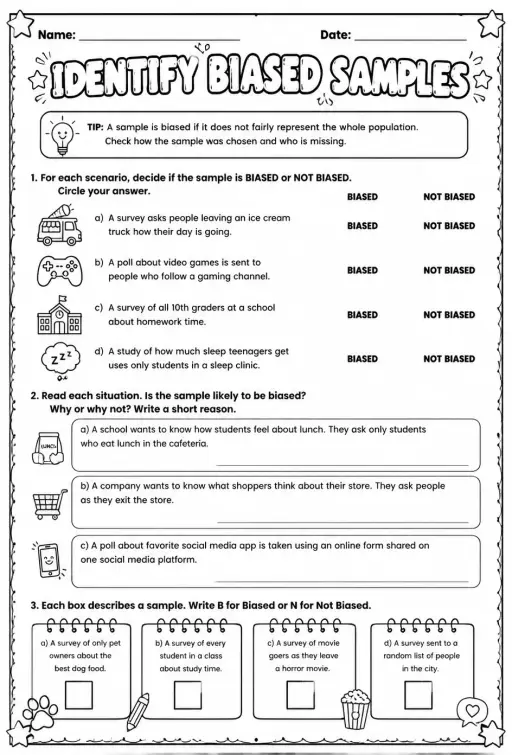
Identify Biased Samples: Circle, Explain and Label B or N
MathHigh School

Identify Biased Samples: Circle, Explain and Label B or N

Students circle BIASED or NOT BIASED for four scenarios, such as asking people leaving an ice cream truck, then write a short reason for three situations. In the last section they label four notepad samples B or N.

——

Likes & comments

See what other teachers think and share a helpful note.

Loading likes and comments…
Worksheet Studio

Need a different version? Make your own.

Generate a fresh worksheet for any grade, topic and language. Free.

Open Worksheet Studio